
AMD stock forecast: Consolidation near $516.12–$582.62 range

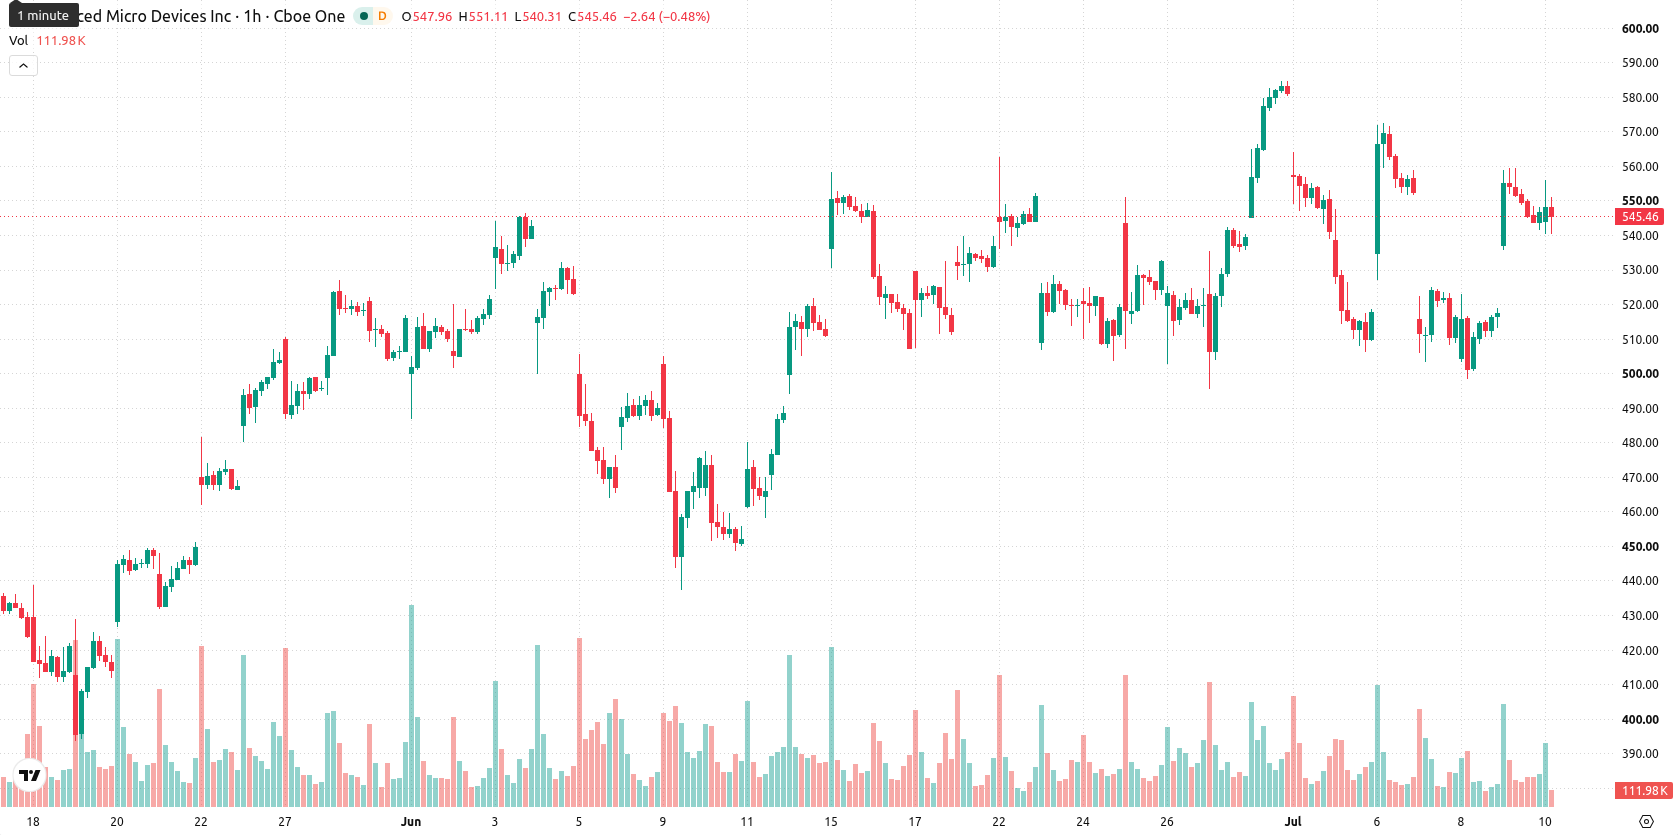
Advanced Micro Devices, Inc. (AMD) stock is trading at $549.37 after a modest gain during the latest session. The price sits above its key moving averages, reflecting ongoing strength against short- and medium-term trend benchmarks.
 553.07
572.50
553.07
572.50
Highlights
- Attention intensifies ahead of AMD's fiscal Q2 2026 results set for August 4, with investors preparing for potential volatility.
- Market participants are positioning speculatively as the earnings event may prompt notable shifts in short-term liquidity flows.
- Technically, AMD maintains a bullish price structure with strong buyer presence, trading in a projected $516.12–$582.62 channel, though overbought signals suggest possible near-term exhaustion.
Speculative positioning rises as market braces for earnings release
Investor attention centers on AMD's upcoming fiscal second quarter 2026 financial results, scheduled for release on August 4, 2026, according to Tradingkey. Anticipation surrounding the earnings event typically heightens speculative positioning and may prompt shifts in short-term liquidity. The scheduled disclosure draws market focus to AMD as participants weigh potential outcomes and prepare for possible volatility.
Overbought signals and mixed momentum warn of possible exhaustion
On the technical front, AMD continues to hold above its hourly moving averages at $527.03 (MA-20) and $540.42 (MA-50), with the daily MA-200 providing a longer-term base at $285.65. The Ichimoku Kijun level on the daily chart is located at $530.85 and acts as immediate support. Momentum indicators present a complex picture: the Moving Average Convergence Divergence (MACD) signals bullish momentum, while the Average Directional Index (ADX) points to a neutral trend. The Relative Strength Index (RSI) at 57.01 and the Commodity Channel Index (CCI) reflect mild buying pressure. Both Stochastic RSI and Bull/Bear Power are in overbought territory, indicating strong intraday demand, whereas the Awesome Oscillator (AO) remains neutral. This combination of overbought oscillators and divergent momentum signals hints at the possibility of short-term exhaustion.
Volatility range defines outlook as event risk looms
In the near term, AMD is expected to trade within a typical volatility band between $516.12 and $582.62. The baseline scenario is for the price to remain within this range. A break above the upper boundary would set up further upside momentum, while a move below support could increase the probability of a minor correction. Scenario planning should be attentive to range boundaries and potential reactions to upcoming events.
Previously it was reported that AMD was exhibiting bullish momentum as investors anticipated key earnings and monitored robust price trends above major moving averages. With the latest technicals showing mixed signals—combining ongoing strength with emerging signs of short-term exhaustion—market participants should pay close attention to price action around the current volatility boundaries for potential breakout or reversal opportunities.










-
 Afghanistan
-
 Albania
-
 Algeria
-
 Angola
-
 Argentina
-
 Armenia
-
 Australia
-
 Austria
-
 Azerbaijan
-
 Bahamas
-
 Bahrain
-
 Bangladesh
-
 Belarus
-
 Belgium
-
 Bolivia
-
 Botswana
-
 Brazil
-
 Brunei
-
 Bulgaria
-
 Cambodia
-
 Cameroon
-
 Canada
-
 Chile
Chile
-
 China
China
-
 Colombia
-
 Congo
Congo
-
 Costa Rica
-
 Cote d'Ivoire
-
 Croatia
-
 Cuba
Cuba
-
 Cyprus
-
 Czechia
-
 DR Congo
-
 Denmark
-
 Dominican Republic
-
 Ecuador
-
 Egypt
Egypt
-
 El Salvador
-
 Estonia
-
 Eswatini
-
 Ethiopia
-
 Finland
-
 France
-
 Georgia
-
 Germany
-
 Ghana
Ghana
-
 Greece
-
 Haiti
Haiti
-
 Hong Kong
-
 Hungary
-
 India
India
-
 Indonesia
-
 Iran, Islamic republic
-
 Iraq
Iraq
-
 Ireland
-
 Israel
-
 Italy
Italy
-
 Jamaica
-
 Japan
Japan
-
 Jordan
-
 Kazakhstan
-
 Kenya
Kenya
-
 Korea
Korea
-
 Kuwait
-
 Kyrgyzstan
-
 Laos
Laos
-
 Latvia
-
 Lebanon
-
 Lesotho
-
 Libya
Libya
-
 Lithuania
-
 Luxembourg
-
 Madagascar
-
 Malaysia
-
 Malta
Malta
-
 Mauritius
-
 Mexico
-
 Moldova
-
 Mongolia
-
 Montenegro
-
 Morocco
-
 Mozambique
-
 Myanmar
-
 Namibia
-
 Nepal
Nepal
-
 Netherlands
-
 New Zealand
-
 Nigeria
-
 North Macedonia
-
 Norway
-
 Oman
Oman
-
 Pakistan
-
 Palestine
-
 Panama
-
 Papua New Guinea
-
 Paraguay
-
 Peru
Peru
-
 Philippines
-
 Poland
-
 Portugal
-
 Puerto Rico
-
 Qatar
Qatar
-
 Reunion
-
 Romania
-
 Rwanda
-
 Saudi Arabia
-
 Serbia
-
 Singapore
-
 Slovakia
-
 Slovenia
-
 Somalia
-
 South Africa
-
 Spain
Spain
-
 Sri Lanka
-
 Sweden
-
 Switzerland
-
 Syria
Syria
-
 Taiwan
-
 Tajikistan
-
 Tanzania
-
 Thailand
-
 Trinidad and Tobago
-
 Tunisia
-
 Turkey
-
 UAE
UAE
-
 Uganda
-
 Ukraine
-
 United Kingdom
-
United States
-
 Uruguay
-
 Uzbekistan
-
 Venezuela
-
 Vietnam
-
 Yemen
Yemen
-
 Zambia
-
 Zimbabwe
- Forex
- Crypto











