
CleanSpark shares technical analysis: Pullback deepens within $11.59–$13.39 range

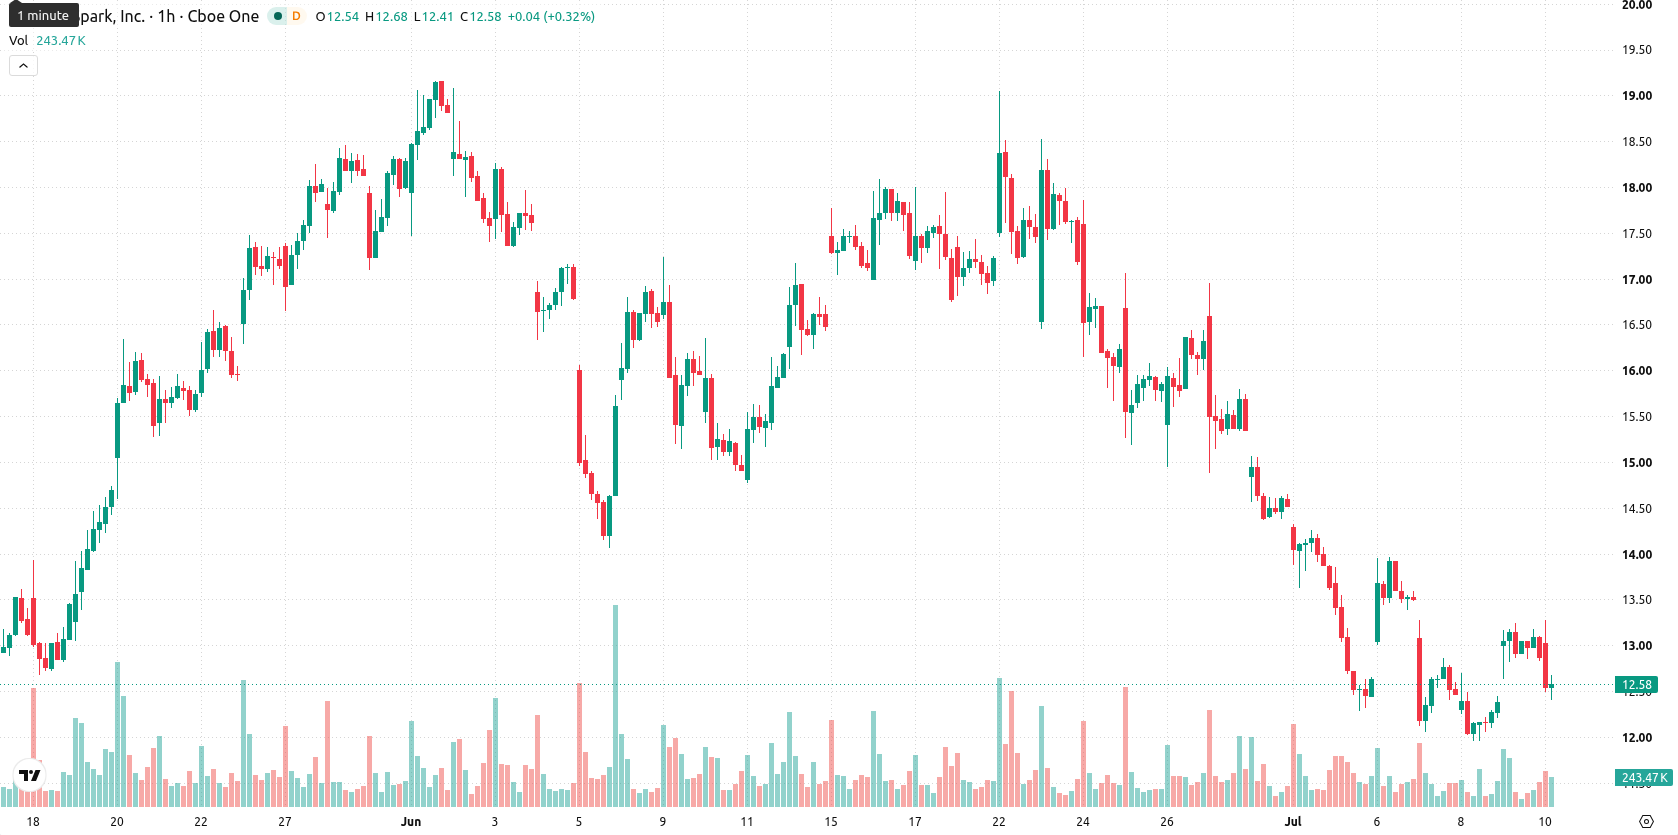
CleanSpark (CLSK) stock is trading at $12.49, down 3.1% for the day and near the session low. The price currently sits below its key moving averages, reflecting sustained short-term and longer-term downside momentum.
 13.24
13.97
13.24
13.97
Highlights
- CleanSpark mined 614 Bitcoin in June 2026, achieving a record 50 EH/s hashrate and expanding facility operations in Texas and Sandersville.
- BTC holdings reached 13,924, enhancing the company's liquidity and digital asset exposure amid continued infrastructure growth.
- CLSK/USD remains under broad selling pressure, trading below major moving averages, with a projected range of $11.59 to $13.39 and further downside risk prevailing.
Operational expansion boosts Bitcoin output amid persistent share selloff
CleanSpark reported unaudited operating results for June 2026, disclosing the production of 614 Bitcoin, a new operational hashrate high of 50 EH/s, and total holdings of 13,924 BTC as the company continued to energize and commercialize new facilities in Texas and Sandersville, according to Simplywall. These achievements demonstrate material expansion in mining infrastructure and output, increasing the company's liquidity and exposure to the digital asset market. The latest operational progress has provided an improved fundamental backdrop, though price action has remained under broader selling pressure.
Mixed momentum signals emerge as CLSK tests overlapping resistance
On the technical front, CLSK trades below the 20-period moving average at $12.66 and the 50-period moving average at $13.25 on the hourly chart, as well as beneath the 200-period moving average at $13.31 on the daily timeframe. The Ichimoku Kijun level at $12.93 forms immediate resistance. Momentum indicators are mixed: the Moving Average Convergence Divergence (MACD) gives a strong sell signal, while the Average Directional Index (ADX) also signals a negative trend. The Relative Strength Index (RSI) stands at 53.87 and the Commodity Channel Index (CCI) also shows a buy signal, while Bull/Bear Power points to intraday buyer pressure. However, the Stochastic RSI is overbought, and the Awesome Oscillator remains neutral, suggesting mixed intraday bias.
Downside risk dominates as CLSK faces critical range boundaries
Looking ahead, CLSK is expected to trade within a $11.59 to $13.39 range over the next two to three trading days, consistent with observed volatility bands. The model assigns a 36% probability to a move higher and sees greater risk of further decline. The baseline scenario projects continued range-bound action, with a bullish breakout requiring a clear move above $12.93 resistance, while a drop below $11.59 support would confirm a fresh bearish extension.
Earlier, analysts noted that CleanSpark's operational advances were tempered by persistent technical weakness and elevated bearish sentiment. The latest trading action underscores ongoing downside momentum despite improved fundamentals, making a sustained move above $12.93 resistance crucial for a shift in directional bias.



Latest CleanSpark News





-
 Afghanistan
-
 Albania
-
 Algeria
-
 Angola
-
 Argentina
-
 Armenia
-
 Australia
-
 Austria
-
 Azerbaijan
-
 Bahamas
-
 Bahrain
-
 Bangladesh
-
 Belarus
-
 Belgium
-
 Bolivia
-
 Botswana
-
 Brazil
-
 Brunei
-
 Bulgaria
-
 Cambodia
-
 Cameroon
-
 Canada
-
 Chile
Chile
-
 China
China
-
 Colombia
-
 Congo
Congo
-
 Costa Rica
-
 Cote d'Ivoire
-
 Croatia
-
 Cuba
Cuba
-
 Cyprus
-
 Czechia
-
 DR Congo
-
 Denmark
-
 Dominican Republic
-
 Ecuador
-
 Egypt
Egypt
-
 El Salvador
-
 Estonia
-
 Eswatini
-
 Ethiopia
-
 Finland
-
 France
-
 Georgia
-
 Germany
-
 Ghana
Ghana
-
 Greece
-
 Haiti
Haiti
-
 Hong Kong
-
 Hungary
-
 India
India
-
 Indonesia
-
 Iran, Islamic republic
-
 Iraq
Iraq
-
 Ireland
-
 Israel
-
 Italy
Italy
-
 Jamaica
-
 Japan
Japan
-
 Jordan
-
 Kazakhstan
-
 Kenya
Kenya
-
 Korea
Korea
-
 Kuwait
-
 Kyrgyzstan
-
 Laos
Laos
-
 Latvia
-
 Lebanon
-
 Lesotho
-
 Libya
Libya
-
 Lithuania
-
 Luxembourg
-
 Madagascar
-
 Malaysia
-
 Malta
Malta
-
 Mauritius
-
 Mexico
-
 Moldova
-
 Mongolia
-
 Montenegro
-
 Morocco
-
 Mozambique
-
 Myanmar
-
 Namibia
-
 Nepal
Nepal
-
 Netherlands
-
 New Zealand
-
 Nigeria
-
 North Macedonia
-
 Norway
-
 Oman
Oman
-
 Pakistan
-
 Palestine
-
 Panama
-
 Papua New Guinea
-
 Paraguay
-
 Peru
Peru
-
 Philippines
-
 Poland
-
 Portugal
-
 Puerto Rico
-
 Qatar
Qatar
-
 Reunion
-
 Romania
-
 Rwanda
-
 Saudi Arabia
-
 Serbia
-
 Singapore
-
 Slovakia
-
 Slovenia
-
 Somalia
-
 South Africa
-
 Spain
Spain
-
 Sri Lanka
-
 Sweden
-
 Switzerland
-
 Syria
Syria
-
 Taiwan
-
 Tajikistan
-
 Tanzania
-
 Thailand
-
 Trinidad and Tobago
-
 Tunisia
-
 Turkey
-
 UAE
UAE
-
 Uganda
-
 Ukraine
-
 United Kingdom
-
United States
-
 Uruguay
-
 Uzbekistan
-
 Venezuela
-
 Vietnam
-
 Yemen
Yemen
-
 Zambia
-
 Zimbabwe
- Forex
- Crypto











