
Will lower AI pricing pressure Palo Alto Networks stock? Key range back in focus

Palo Alto Networks (PANW) stock is trading at $328.49, down 2.9% on the day. The price has moved lower and now sits below its key short- and medium-term moving averages, reflecting notable daily weakness.
 339.16
368.17
339.16
368.17
Highlights
- Palo Alto Networks has patched 13 major PAN-OS vulnerabilities, reducing operational risk and reinforcing enterprise client confidence.
- A new partnership with Tenzai leverages AI-driven attack simulations to strengthen security across the Cortex XDR platform.
- PANW is experiencing short- and medium-term bearish momentum with downside likely, trading between $304.69 and $352.29 for the next few days.
Vulnerability patches and AI adoption as trust and cost shape sentiment
Palo Alto Networks has released patches addressing 13 vulnerabilities in its PAN-OS software, including issues such as buffer overflow, denial of service, command injection, server-side request forgery, and authentication bypass, according to Securityweek. This action reduces operational risk and helps maintain trust among its enterprise clients. Separately, a new collaboration with Tenzai is leveraging AI-driven adversarial attack simulations to strengthen Cortex XDR security, as reported by Simplywall. CEO Nikesh Arora also noted in CNBC that broader enterprise adoption of artificial intelligence will require a significant reduction in pricing, highlighting a cost barrier for further rollout.
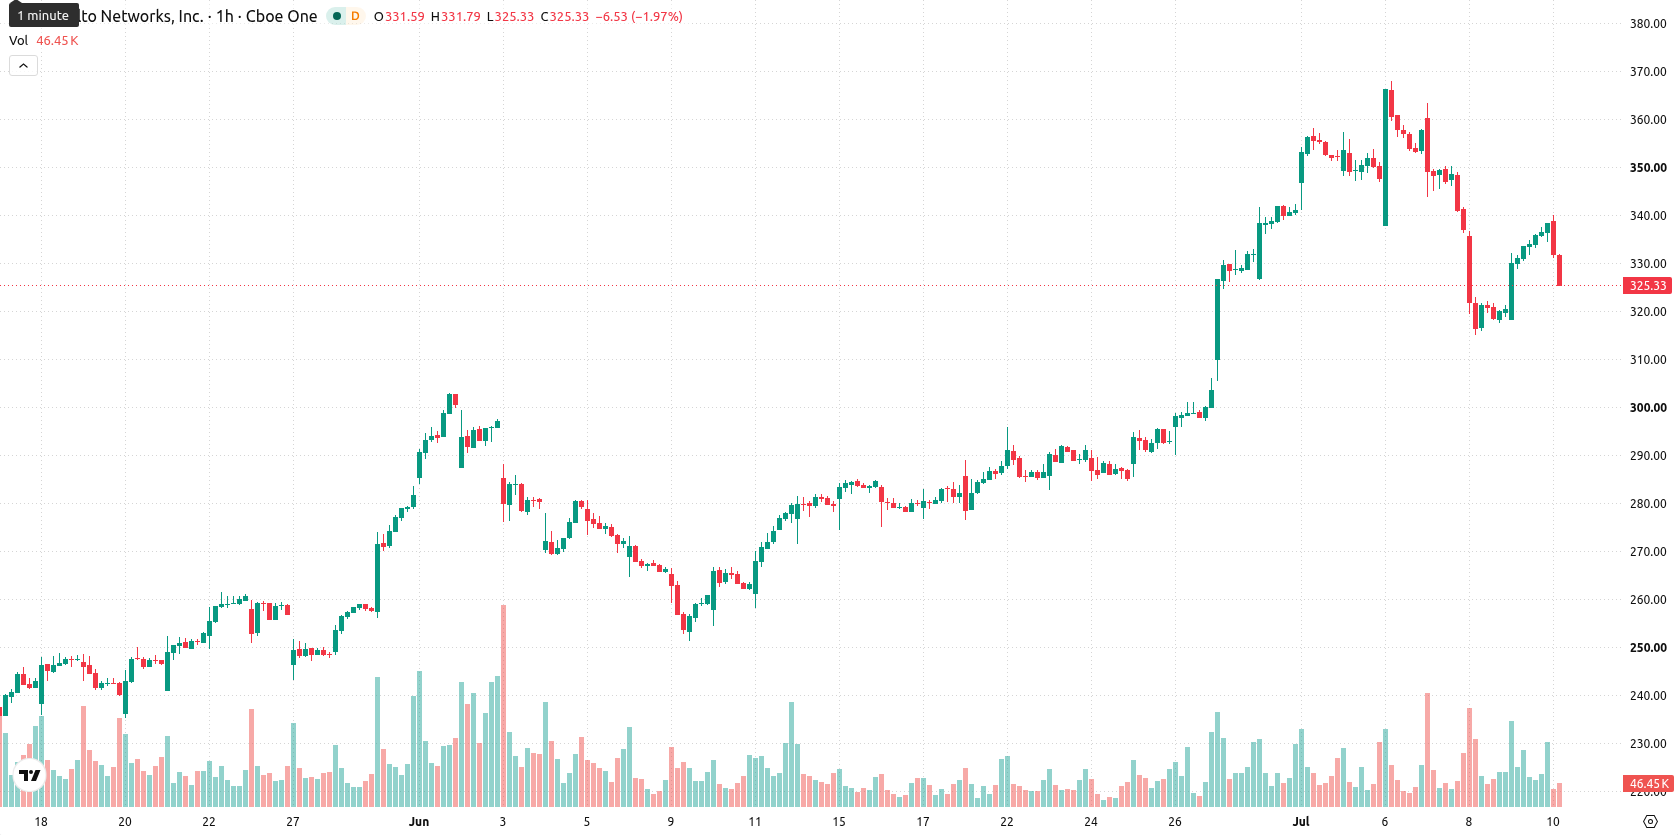
Bearish momentum prevails as price tests support and resistance levels
On the hourly chart, PANW is trading below the 20-period and 50-period moving averages, while remaining above the 200-period moving average. The Ichimoku Kijun at $338.91 serves as the closest resistance. Momentum remains negative, with the Moving Average Convergence Divergence (MACD) in strong sell, and the Average Directional Index (ADX) signaling continued bearish pressure. The Relative Strength Index (RSI) reads at 43.3, pointing to weak downside traction. Both the Stochastic RSI and Commodity Channel Index (CCI) are neutral, while Bull/Bear Power signals an oversold condition. The Awesome Oscillator is flat, offering no directional bias.
Downside risk dominates as volatility bands define short-term outlook
Over the next two to three trading days, PANW is projected to trade within a typical volatility band between $304.69 and $352.29. Downside continuation is favored, with a 74% probability of further decline versus 26% odds of a rebound. The baseline scenario is for a range-bound market, but a move through resistance at $338.91 could shift the setup to more bullish conditions, while a break below $304.69 would confirm an extended bearish trend.
Earlier, analysts noted that Palo Alto Networks faced persistent downside momentum amid conflicting technical signals and evolving operational risks. With the latest cybersecurity updates and strategic partnerships yet unable to offset broad market weakness, traders should watch for confirmation of a shift in sentiment either through a sustained rebound above resistance or an acceleration of losses below support.



Latest Palo Alto Networks News







-
 Afghanistan
-
 Albania
-
 Algeria
-
 Angola
-
 Argentina
-
 Armenia
-
 Australia
-
 Austria
-
 Azerbaijan
-
 Bahamas
-
 Bahrain
-
 Bangladesh
-
 Belarus
-
 Belgium
-
 Bolivia
-
 Botswana
-
 Brazil
-
 Brunei
-
 Bulgaria
-
 Cambodia
-
 Cameroon
-
 Canada
-
 Chile
Chile
-
 China
China
-
 Colombia
-
 Congo
Congo
-
 Costa Rica
-
 Cote d'Ivoire
-
 Croatia
-
 Cuba
Cuba
-
 Cyprus
-
 Czechia
-
 DR Congo
-
 Denmark
-
 Dominican Republic
-
 Ecuador
-
 Egypt
Egypt
-
 El Salvador
-
 Estonia
-
 Eswatini
-
 Ethiopia
-
 Finland
-
 France
-
 Georgia
-
 Germany
-
 Ghana
Ghana
-
 Greece
-
 Haiti
Haiti
-
 Hong Kong
-
 Hungary
-
 India
India
-
 Indonesia
-
 Iran, Islamic republic
-
 Iraq
Iraq
-
 Ireland
-
 Israel
-
 Italy
Italy
-
 Jamaica
-
 Japan
Japan
-
 Jordan
-
 Kazakhstan
-
 Kenya
Kenya
-
 Korea
Korea
-
 Kuwait
-
 Kyrgyzstan
-
 Laos
Laos
-
 Latvia
-
 Lebanon
-
 Lesotho
-
 Libya
Libya
-
 Lithuania
-
 Luxembourg
-
 Madagascar
-
 Malaysia
-
 Malta
Malta
-
 Mauritius
-
 Mexico
-
 Moldova
-
 Mongolia
-
 Montenegro
-
 Morocco
-
 Mozambique
-
 Myanmar
-
 Namibia
-
 Nepal
Nepal
-
 Netherlands
-
 New Zealand
-
 Nigeria
-
 North Macedonia
-
 Norway
-
 Oman
Oman
-
 Pakistan
-
 Palestine
-
 Panama
-
 Papua New Guinea
-
 Paraguay
-
 Peru
Peru
-
 Philippines
-
 Poland
-
 Portugal
-
 Puerto Rico
-
 Qatar
Qatar
-
 Reunion
-
 Romania
-
 Rwanda
-
 Saudi Arabia
-
 Serbia
-
 Singapore
-
 Slovakia
-
 Slovenia
-
 Somalia
-
 South Africa
-
 Spain
Spain
-
 Sri Lanka
-
 Sweden
-
 Switzerland
-
 Syria
Syria
-
 Taiwan
-
 Tajikistan
-
 Tanzania
-
 Thailand
-
 Trinidad and Tobago
-
 Tunisia
-
 Turkey
-
 UAE
UAE
-
 Uganda
-
 Ukraine
-
 United Kingdom
-
United States
-
 Uruguay
-
 Uzbekistan
-
 Venezuela
-
 Vietnam
-
 Yemen
Yemen
-
 Zambia
-
 Zimbabwe
- Forex
- Crypto











