
Robinhood shares slip below $106.2–$114.72 range as selloff intensifies

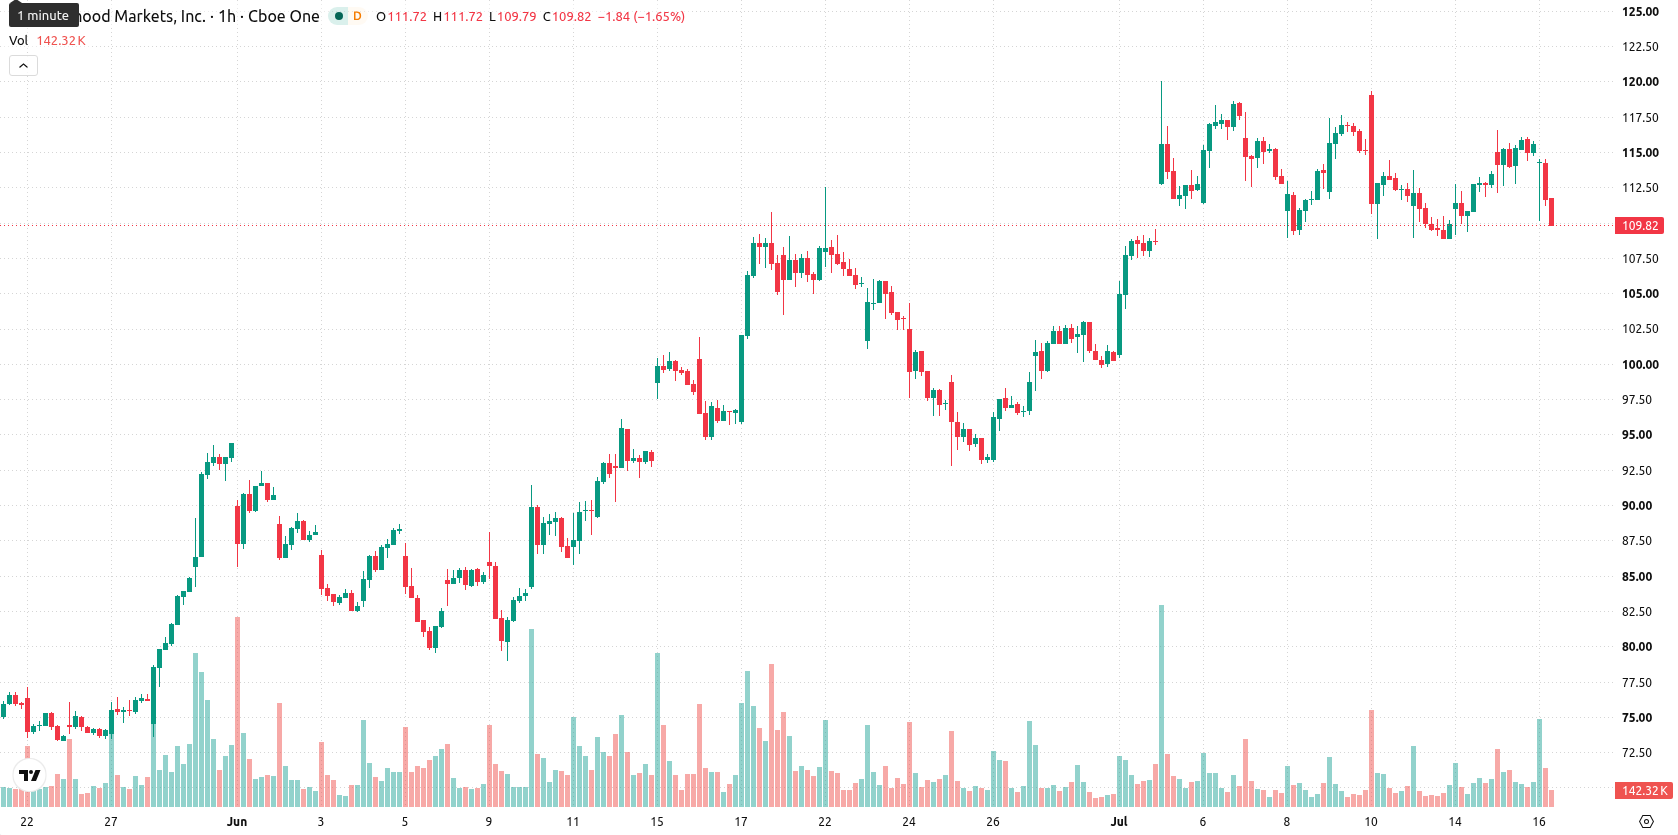
Robinhood (HOOD) stock is trading at $110.45, down 4.41% on the day. The price currently sits below its key moving averages, reflecting continued intraday volatility.
 102.29
116.60
102.29
116.60
Highlights
- Robinhood's launch of its Ethereum Layer 2 Robinhood Chain generated over 1 million active wallets and $3.1 billion in trading volume within two weeks.
- Ark Invest reduced its exposure to Robinhood by selling $3.2 million in shares, potentially contributing to the recent supply overhang.
- Robinhood shares face near-term selling pressure below key averages, with expected consolidation in the $106.2 to $114.72 range, as mixed technical signals persist.
Blockchain expansion and Ark’s sale shift stock sentiment
Robinhood launched its Ethereum Layer 2 network, Robinhood Chain, on July 1, 2026, and achieved rapid traction by surpassing 1 million active wallets and generating $3.1 billion in decentralized exchange trading volume in its initial two weeks, according to Cryptobriefing. This initiative represents an expansion of Robinhood’s blockchain capabilities and introduces a potential new revenue stream centered on crypto transaction activity. Meanwhile, Ark Invest reduced its holding in Robinhood by selling $3.2 million worth of shares, as reported by Theblock, an action that may have added to the recent supply overhang.
Resistance levels cap gains as momentum indicators remain neutral
The price of HOOD is trading below the $112.82 MA-20 and $113.18 MA-50 on the hourly chart, while remaining above the $102.01 MA-200 on the daily timeframe. Immediate resistance is established at the Ichimoku Kijun level of $112.73. The Moving Average Convergence Divergence (MACD) indicates a buy signal, and the Average Directional Index (ADX) is neutral, signifying muted trend momentum. The Relative Strength Index (RSI) sits in buy territory at 51.98, whereas both the Stochastic RSI and Commodity Channel Index (CCI) register neutral readings, confirming the absence of clear overbought or oversold pressures. Bull/Bear Power shows buyers holding some intraday advantage; meanwhile, the Awesome Oscillator remains neutral, reflecting the indecisive tone of current momentum indicators.
Sideways consolidation likely as volatility bands define outlook
Over the next 2 to 3 sessions, HOOD is expected to trade within a range of $106.2 to $114.72, reflecting typical volatility band relative to current levels. The most probable scenario is for the stock to consolidate sideways in this interval, with a 63% probability of upward movement and a 37% likelihood of a further decline. A break above $112.73 would suggest a potential move higher toward the top of the short-term range, while a fall below $106.2 would open the way for deeper retracement.
Earlier, analysts noted that Robinhood's bullish momentum was supported by strong technical buying and new product developments, particularly the launch of Robinhood Chain. The latest price action and user growth on the blockchain network introduce a potential shift in underlying drivers, making the $112.73 Ichimoku Kijun level a key threshold for traders to monitor in assessing breakout or consolidation scenarios.


Latest Robinhood News







-
 Afghanistan
-
 Albania
-
 Algeria
-
 Angola
-
 Argentina
-
 Armenia
-
 Australia
-
 Austria
-
 Azerbaijan
-
 Bahamas
-
 Bahrain
-
 Bangladesh
-
 Belarus
-
 Belgium
-
 Bolivia
-
 Botswana
-
 Brazil
-
 Brunei
-
 Bulgaria
-
 Cambodia
-
 Cameroon
-
 Canada
-
 Chile
Chile
-
 China
China
-
 Colombia
-
 Congo
Congo
-
 Costa Rica
-
 Cote d'Ivoire
-
 Croatia
-
 Cuba
Cuba
-
 Cyprus
-
 Czechia
-
 DR Congo
-
 Denmark
-
 Dominican Republic
-
 Ecuador
-
 Egypt
Egypt
-
 El Salvador
-
 Estonia
-
 Eswatini
-
 Ethiopia
-
 Finland
-
 France
-
 Georgia
-
 Germany
-
 Ghana
Ghana
-
 Greece
-
 Haiti
Haiti
-
 Hong Kong
-
 Hungary
-
 India
India
-
 Indonesia
-
 Iran, Islamic republic
-
 Iraq
Iraq
-
 Ireland
-
 Israel
-
 Italy
Italy
-
 Jamaica
-
 Japan
Japan
-
 Jordan
-
 Kazakhstan
-
 Kenya
Kenya
-
 Korea
Korea
-
 Kuwait
-
 Kyrgyzstan
-
 Laos
Laos
-
 Latvia
-
 Lebanon
-
 Lesotho
-
 Libya
Libya
-
 Lithuania
-
 Luxembourg
-
 Madagascar
-
 Malaysia
-
 Malta
Malta
-
 Mauritius
-
 Mexico
-
 Moldova
-
 Mongolia
-
 Montenegro
-
 Morocco
-
 Mozambique
-
 Myanmar
-
 Namibia
-
 Nepal
Nepal
-
 Netherlands
-
 New Zealand
-
 Nigeria
-
 North Macedonia
-
 Norway
-
 Oman
Oman
-
 Pakistan
-
 Palestine
-
 Panama
-
 Papua New Guinea
-
 Paraguay
-
 Peru
Peru
-
 Philippines
-
 Poland
-
 Portugal
-
 Puerto Rico
-
 Qatar
Qatar
-
 Reunion
-
 Romania
-
 Rwanda
-
 Saudi Arabia
-
 Serbia
-
 Singapore
-
 Slovakia
-
 Slovenia
-
 Somalia
-
 South Africa
-
 Spain
Spain
-
 Sri Lanka
-
 Sweden
-
 Switzerland
-
 Syria
Syria
-
 Taiwan
-
 Tajikistan
-
 Tanzania
-
 Thailand
-
 Trinidad and Tobago
-
 Tunisia
-
 Turkey
-
 UAE
UAE
-
 Uganda
-
 Ukraine
-
 United Kingdom
-
United States
-
 Uruguay
-
 Uzbekistan
-
 Venezuela
-
 Vietnam
-
 Yemen
Yemen
-
 Zambia
-
 Zimbabwe
- Forex
- Crypto











