
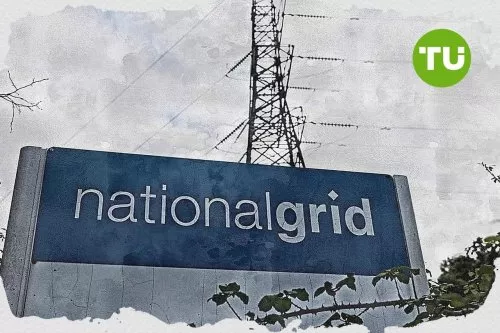
Can National Grid stock break resistance as US power infrastructure investment boosts sentiment?

National Grid (NG) stock is trading at GBX1,244, showing a daily advance of 2.3% and ending the session near the day's highs. The price sits above its key moving averages, reflecting dominant short-term momentum.
 1255.00
1262.50
1255.00
1262.50
Highlights
- National Grid is investing $1.75 billion for a 35% stake in Joulent, expanding its U.S. power infrastructure exposure.
- The company is executing a multi-year capital program across UK and U.S. grids to meet rising electricity demand and accelerate energy transition.
- Shares trade with bullish bias above key moving averages, with price expected to consolidate between GBX1,223 and GBX1,267 over the next few sessions.
US grid expansion drives growth outlook as investment confirmed
National Grid has confirmed a $1.75 billion investment for a 35% stake in Joulent, a U.S. energy platform focused on power infrastructure development, according to Finance Yahoo. This move expands National Grid's presence within the U.S. market and highlights its active allocation of capital toward long-term energy transition opportunities, directly supporting expectations for growth and network expansion. In addition, National Grid has outlined a long-term capital investment programme covering both its UK and US grid assets to support rising electricity demand and facilitate the energy transition, as reported by Kalkinemedia, reinforcing expectations of future strategic alignment with sector trends.
Mixed signals emerge as overbought momentum meets conflicting indicators
Price action currently sits above the MA-20 (GBX1,228) and MA-50 (GBX1,232) on the H1 timeframe, as well as the MA-200 (GBX1,223) on the daily chart. The Ichimoku Kijun line at GBX1,227 serves as immediate support. The Relative Strength Index (RSI) prints 60.17, indicating higher-than-average strength, while both the Commodity Channel Index (CCI) and Stochastic RSI signal overbought conditions. Bull/Bear Power continues to reflect intraday buyer dominance. In contrast, the Moving Average Convergence Divergence (MACD) gives a strong sell reading, while the Average Directional Index (ADX) and Awesome Oscillator remain neutral. The divergence between bullish and bearish momentum signals creates a mixed technical posture.
Consolidation expected as volatility persists within key support range
Over the next two to three trading days, the price is expected to fluctuate within a volatility band between GBX1,223 and GBX1,267. There is a 73% probability of further upside, with a lower chance of a downward correction. The baseline scenario favors continued consolidation within this corridor, while a break above resistance could carry the price toward the upper range. Conversely, a move below GBX1,227 support would increase the likelihood of a near-term pullback.
Earlier, analysts noted that National Grid's strategic investment in the U.S. energy sector underscored its commitment to long-term network growth, while technical momentum remained mixed. With the current consolidation and prevailing buyer dominance, traders should focus on a potential breakout above the established volatility band as a catalyst for the next directional move.


Latest National Grid News






-
 Afghanistan
-
 Albania
-
 Algeria
-
 Angola
-
 Argentina
-
 Armenia
-
 Australia
-
 Austria
-
 Azerbaijan
-
 Bahamas
-
 Bahrain
-
 Bangladesh
-
 Belarus
-
 Belgium
-
 Bolivia
-
 Botswana
-
 Brazil
-
 Brunei
-
 Bulgaria
-
 Cambodia
-
 Cameroon
-
 Canada
-
 Chile
Chile
-
 China
China
-
 Colombia
-
 Congo
Congo
-
 Costa Rica
-
 Cote d'Ivoire
-
 Croatia
-
 Cuba
Cuba
-
 Cyprus
-
 Czechia
-
 DR Congo
-
 Denmark
-
 Dominican Republic
-
 Ecuador
-
 Egypt
Egypt
-
 El Salvador
-
 Estonia
-
 Eswatini
-
 Ethiopia
-
 Finland
-
 France
-
 Georgia
-
 Germany
-
 Ghana
Ghana
-
 Greece
-
 Haiti
Haiti
-
 Hong Kong
-
 Hungary
-
 India
India
-
 Indonesia
-
 Iran, Islamic republic
-
 Iraq
Iraq
-
 Ireland
-
 Israel
-
 Italy
Italy
-
 Jamaica
-
 Japan
Japan
-
 Jordan
-
 Kazakhstan
-
 Kenya
Kenya
-
 Korea
Korea
-
 Kuwait
-
 Kyrgyzstan
-
 Laos
Laos
-
 Latvia
-
 Lebanon
-
 Lesotho
-
 Libya
Libya
-
 Lithuania
-
 Luxembourg
-
 Madagascar
-
 Malaysia
-
 Malta
Malta
-
 Mauritius
-
 Mexico
-
 Moldova
-
 Mongolia
-
 Montenegro
-
 Morocco
-
 Mozambique
-
 Myanmar
-
 Namibia
-
 Nepal
Nepal
-
 Netherlands
-
 New Zealand
-
 Nigeria
-
 North Macedonia
-
 Norway
-
 Oman
Oman
-
 Pakistan
-
 Palestine
-
 Panama
-
 Papua New Guinea
-
 Paraguay
-
 Peru
Peru
-
 Philippines
-
 Poland
-
 Portugal
-
 Puerto Rico
-
 Qatar
Qatar
-
 Reunion
-
 Romania
-
 Rwanda
-
 Saudi Arabia
-
 Serbia
-
 Singapore
-
 Slovakia
-
 Slovenia
-
 Somalia
-
 South Africa
-
 Spain
Spain
-
 Sri Lanka
-
 Sweden
-
 Switzerland
-
 Syria
Syria
-
 Taiwan
-
 Tajikistan
-
 Tanzania
-
 Thailand
-
 Trinidad and Tobago
-
 Tunisia
-
 Turkey
-
 UAE
UAE
-
 Uganda
-
 Ukraine
-
 United Kingdom
-
United States
-
 Uruguay
-
 Uzbekistan
-
 Venezuela
-
 Vietnam
-
 Yemen
Yemen
-
 Zambia
-
 Zimbabwe
- Forex
- Crypto











