
Affirm shares technical analysis: Support test limits further selling pressure

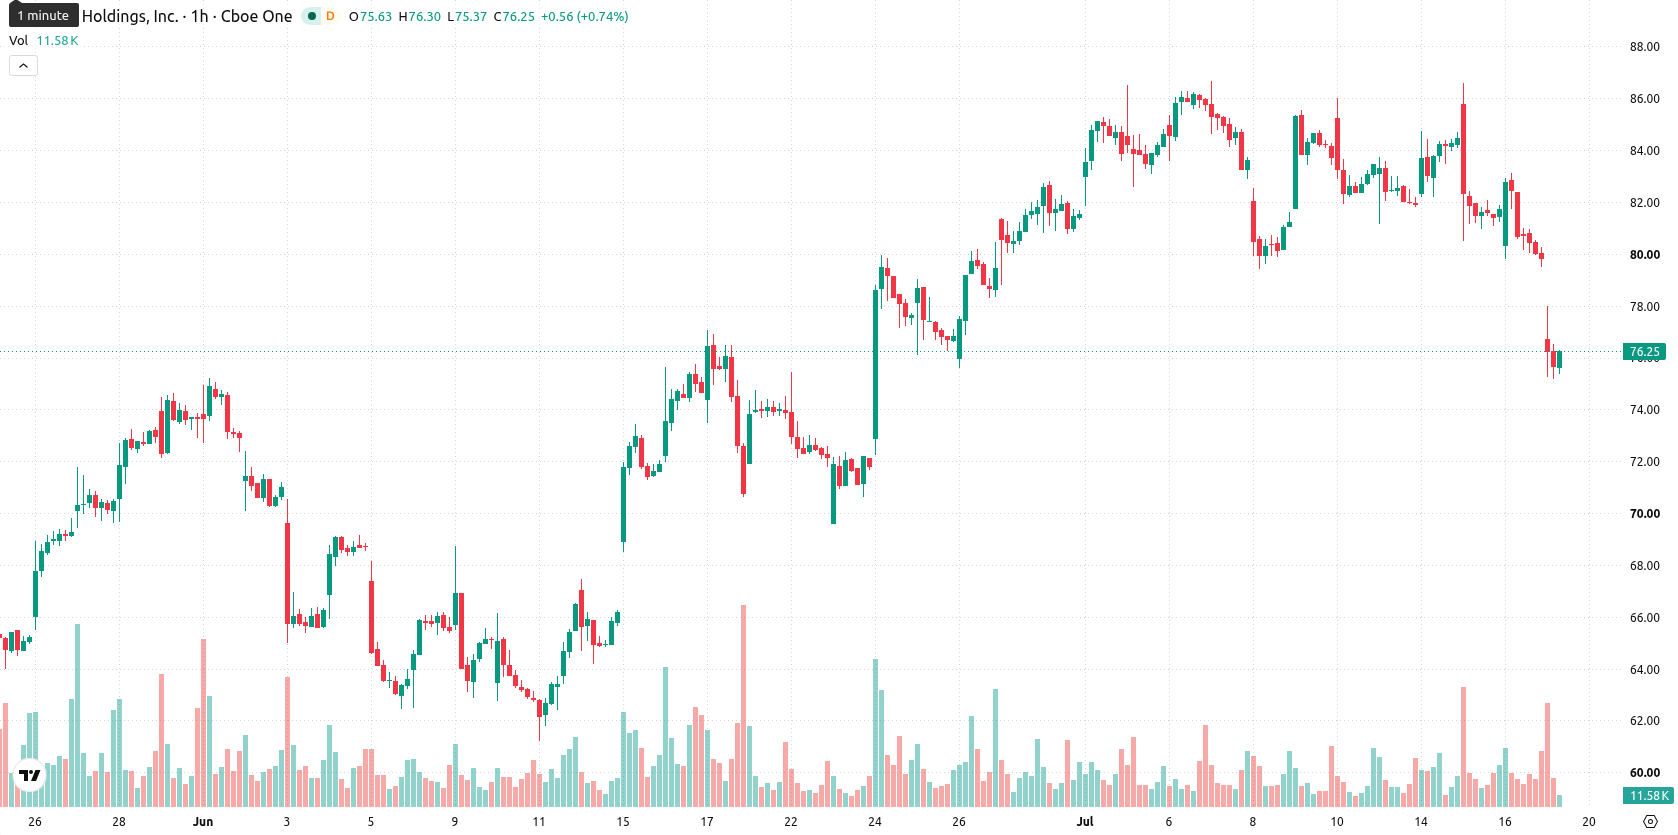
Affirm Holdings Inc. (AFRM) stock is trading at $76.17, marking a daily decline of 4.6%. The price is currently positioned below its key short- and medium-term moving averages yet remains above the longer-term average, reflecting active downward pressure in the short term.
 77.34
86.80
77.34
86.80
Highlights
- Affirm Holdings delivered strong year-over-year revenue growth to $1.04 billion and returned to profitability with a $102.9 million net profit.
- Despite improved operational efficiency and financial results, the stock experienced persistent downward pressure, reflecting subdued investor sentiment.
- Technical signals remain sharply bearish with price trading below short- and medium-term averages and high downside risk toward the $71.37 support range.
Profit return and revenue growth met with persistent selling
Affirm Holdings reported quarterly revenue of $1.04 billion and achieved net profit of $102.9 million, representing a clear return to profitability and significant revenue growth over the prior year, according to Finance Yahoo. These results point to improved efficiency and stronger operating performance, which can enhance investor perceptions of fundamental value. However, this fundamentally positive backdrop has been accompanied by continued selling pressure in the stock price.
Failed resistance retests and unified sell signals drive momentum loss
On the technical front, AFRM failed to reclaim resistance at the Moving Average-20 ($81.44) and Moving Average-50 ($82.18) on the hourly chart, while remaining above the Moving Average-200 ($66.23) on the daily timeframe. Immediate resistance is defined by the Ichimoku Kijun at $81.27. Momentum indicators confirm prevailing downside bias, with the Moving Average Convergence Divergence (MACD), Average Directional Index (ADX), and Awesome Oscillator generating sell signals, while the Relative Strength Index (RSI), Stochastic RSI, Commodity Channel Index (CCI), and Bull/Bear Power all register in oversold or negative territory—aligning strongly with prevailing seller momentum. No significant divergences are observed among oscillators, reinforcing the session's sharp retreat.
Low rebound odds amid bearish risks in upcoming sessions
In the short term, AFRM is likely to trade within a volatility band of $71.37 to $79.47 over the next two to three sessions. The probability of an upside reversal is currently assessed as very low, with bearish follow-through risk remaining elevated. The baseline scenario anticipates price stabilization within this corridor; an upward scenario would require a confirmed breakout above immediate resistance, while a sustained move below support at $71.37 could prompt further declines.
Earlier, analysts noted that Affirm's technical outlook exhibited bullish structural bias despite emerging volatility and signs of momentum uncertainty. The current technical deterioration, set against improving fundamentals, signals that price action may remain constrained by downside risk in the near term, with traders advised to monitor for either a decisive breakdown below $71.37 or confirmation of stabilization within the expected volatility band.









-
 Afghanistan
-
 Albania
-
 Algeria
-
 Angola
-
 Argentina
-
 Armenia
-
 Australia
-
 Austria
-
 Azerbaijan
-
 Bahamas
-
 Bahrain
-
 Bangladesh
-
 Belarus
-
 Belgium
-
 Bolivia
-
 Botswana
-
 Brazil
-
 Brunei
-
 Bulgaria
-
 Cambodia
-
 Cameroon
-
 Canada
-
 Chile
Chile
-
 China
China
-
 Colombia
-
 Congo
Congo
-
 Costa Rica
-
 Cote d'Ivoire
-
 Croatia
-
 Cuba
Cuba
-
 Cyprus
-
 Czechia
-
 DR Congo
-
 Denmark
-
 Dominican Republic
-
 Ecuador
-
 Egypt
Egypt
-
 El Salvador
-
 Estonia
-
 Eswatini
-
 Ethiopia
-
 Finland
-
 France
-
 Georgia
-
 Germany
-
 Ghana
Ghana
-
 Greece
-
 Haiti
Haiti
-
 Hong Kong
-
 Hungary
-
 India
India
-
 Indonesia
-
 Iran, Islamic republic
-
 Iraq
Iraq
-
 Ireland
-
 Israel
-
 Italy
Italy
-
 Jamaica
-
 Japan
Japan
-
 Jordan
-
 Kazakhstan
-
 Kenya
Kenya
-
 Korea
Korea
-
 Kuwait
-
 Kyrgyzstan
-
 Laos
Laos
-
 Latvia
-
 Lebanon
-
 Lesotho
-
 Libya
Libya
-
 Lithuania
-
 Luxembourg
-
 Madagascar
-
 Malaysia
-
 Malta
Malta
-
 Mauritius
-
 Mexico
-
 Moldova
-
 Mongolia
-
 Montenegro
-
 Morocco
-
 Mozambique
-
 Myanmar
-
 Namibia
-
 Nepal
Nepal
-
 Netherlands
-
 New Zealand
-
 Nigeria
-
 North Macedonia
-
 Norway
-
 Oman
Oman
-
 Pakistan
-
 Palestine
-
 Panama
-
 Papua New Guinea
-
 Paraguay
-
 Peru
Peru
-
 Philippines
-
 Poland
-
 Portugal
-
 Puerto Rico
-
 Qatar
Qatar
-
 Reunion
-
 Romania
-
 Rwanda
-
 Saudi Arabia
-
 Serbia
-
 Singapore
-
 Slovakia
-
 Slovenia
-
 Somalia
-
 South Africa
-
 Spain
Spain
-
 Sri Lanka
-
 Sweden
-
 Switzerland
-
 Syria
Syria
-
 Taiwan
-
 Tajikistan
-
 Tanzania
-
 Thailand
-
 Trinidad and Tobago
-
 Tunisia
-
 Turkey
-
 UAE
UAE
-
 Uganda
-
 Ukraine
-
 United Kingdom
-
United States
-
 Uruguay
-
 Uzbekistan
-
 Venezuela
-
 Vietnam
-
 Yemen
Yemen
-
 Zambia
-
 Zimbabwe
- Forex
- Crypto











