
Costco stock holds steady around $940 as mixed technical momentum prevails: weekly outlook

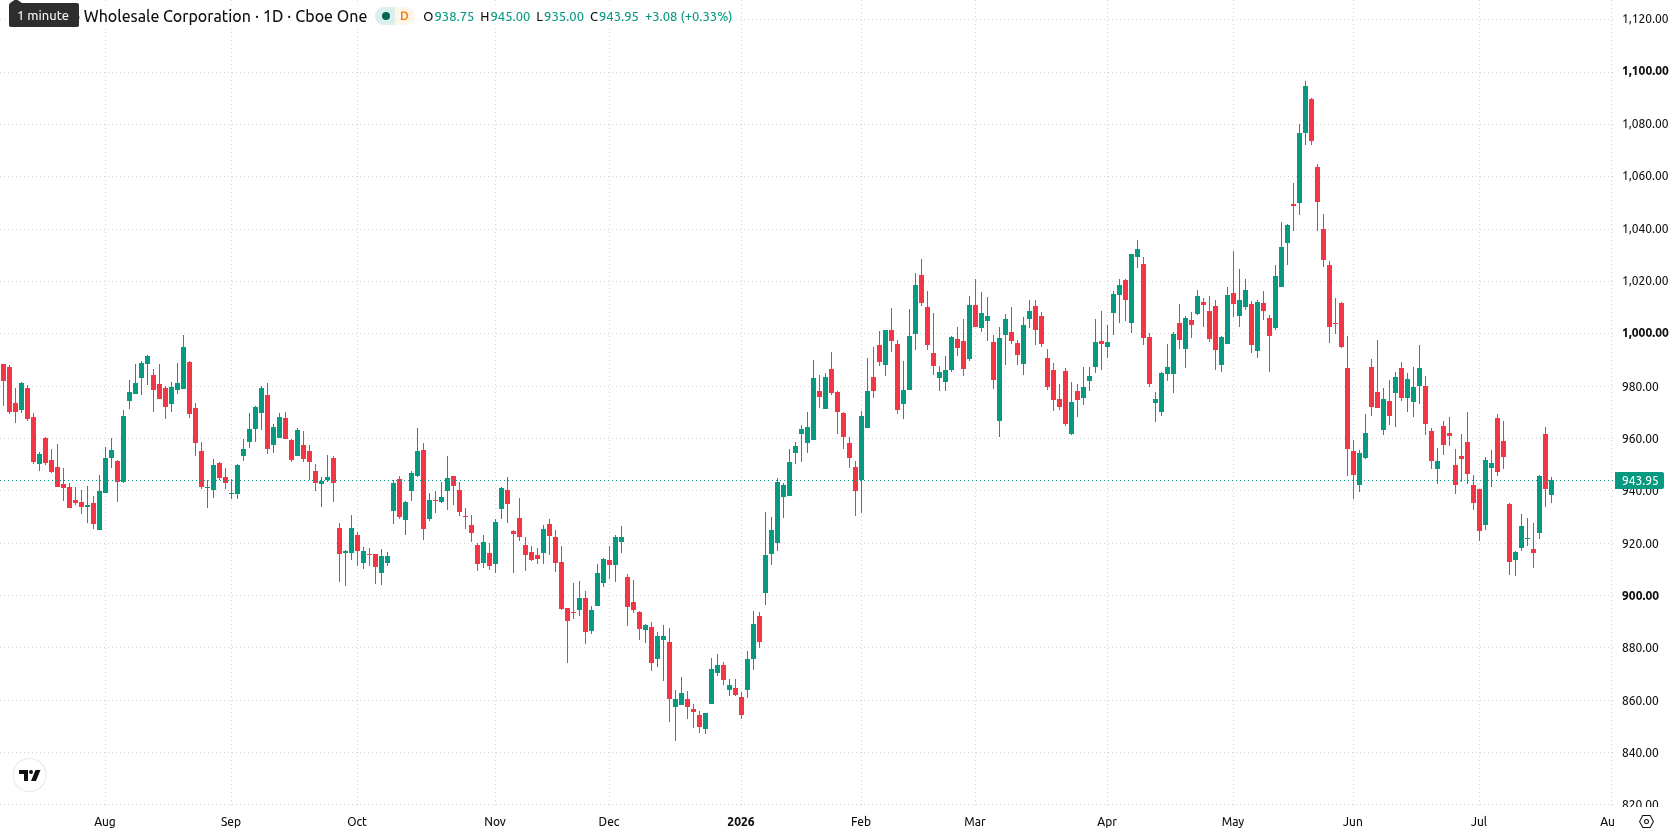
Costco Wholesale Corporation (COST) closed the week at $939.64, down $0.82 or 0.09% from the previous week, with volatility at 5.02%. The price is holding below its weekly MA-20 at $985.23 and MA-50 at $956.61, yet remains comfortably above the MA-200 at $781.04, signaling medium-term seller pressure but firm long-term support.
 944.27
956.18
944.27
956.18
Highlights
- Costco trades below key short- and medium-term moving averages, indicating ongoing seller pressure despite long-term support.
- Momentum signals are mixed, with oscillators mostly oversold and neutral trend indicators suggesting weak directional conviction.
- Expected price range for the next week is $913 to $960, with downside risk elevated and breakout likelihood low.
Strong June sales and new initiatives sustain bullish sentiment this week
Costco reported a 10.6% year-over-year increase in June net sales, totaling $29.24 billion, underlining strong operational momentum and robust membership renewal rates above 90%. The company announced an increased quarterly dividend of $1.47 per share, with payout scheduled in August and the ex-dividend date set for July 24. Additional developments include the planned opening of seven new warehouse locations and the launch of experimental stand-alone gas stations to enhance customer value.
Mixed weekly momentum as oversold signals clash with anchored uptrend
On the weekly chart, Costco is trading below both the MA-20 and MA-50, suggesting prevailing medium-term downside bias, while the price remains well anchored above the MA-200, maintaining the broader uptrend structure. Weekly resistance is near $956, just below the MA-50, while key support is found around $913 and the MA-200 at $781.04. Momentum readings are mixed — the W1 RSI is weak at 44.77 (Sell), CCI and Bull/Bear Power are both in oversold territory, and both the MACD and ADX are neutral, signaling no strong trend. Stochastic RSI gives a strong buy while the Awesome Oscillator stays flat, reflecting indecision and divergence between oversold readings and lagging bullish momentum.
Sideways-to-lower outlook as key indicators flag weak breakout odds
Over the next five trading days, Costco is likely to consolidate within the $913 to $960 range, shaped by muted momentum and resistance near MA-50. There is a significantly higher probability of further downside, as none of the four key weekly indicators are giving buy signals; a drop below $913 may prompt a move toward longer-term supports. A bullish scenario would require a breakout above $960, targeting renewed advances, but based on current data, this is less than a 20% chance. The base case remains sideways-to-lower direction as the stock digests recent selling and waits for stronger directional catalysts.
In a recent review, analysts highlighted that Costco faced persistent medium-term bearish momentum despite strong sales growth, emphasizing ongoing seller control. The current technical outlook not only substantiates this view with continued downside bias and weak buy signals, but also urges traders to closely monitor the $913 support level as a potential trigger for increased volatility in the coming week.









-
 Afghanistan
-
 Albania
-
 Algeria
-
 Angola
-
 Argentina
-
 Armenia
-
 Australia
-
 Austria
-
 Azerbaijan
-
 Bahamas
-
 Bahrain
-
 Bangladesh
-
 Belarus
-
 Belgium
-
 Bolivia
-
 Botswana
-
 Brazil
-
 Brunei
-
 Bulgaria
-
 Cambodia
-
 Cameroon
-
 Canada
-
 Chile
Chile
-
 China
China
-
 Colombia
-
 Congo
Congo
-
 Costa Rica
-
 Cote d'Ivoire
-
 Croatia
-
 Cuba
Cuba
-
 Cyprus
-
 Czechia
-
 DR Congo
-
 Denmark
-
 Dominican Republic
-
 Ecuador
-
 Egypt
Egypt
-
 El Salvador
-
 Estonia
-
 Eswatini
-
 Ethiopia
-
 Finland
-
 France
-
 Georgia
-
 Germany
-
 Ghana
Ghana
-
 Greece
-
 Haiti
Haiti
-
 Hong Kong
-
 Hungary
-
 India
India
-
 Indonesia
-
 Iran, Islamic republic
-
 Iraq
Iraq
-
 Ireland
-
 Israel
-
 Italy
Italy
-
 Jamaica
-
 Japan
Japan
-
 Jordan
-
 Kazakhstan
-
 Kenya
Kenya
-
 Korea
Korea
-
 Kuwait
-
 Kyrgyzstan
-
 Laos
Laos
-
 Latvia
-
 Lebanon
-
 Lesotho
-
 Libya
Libya
-
 Lithuania
-
 Luxembourg
-
 Madagascar
-
 Malaysia
-
 Malta
Malta
-
 Mauritius
-
 Mexico
-
 Moldova
-
 Mongolia
-
 Montenegro
-
 Morocco
-
 Mozambique
-
 Myanmar
-
 Namibia
-
 Nepal
Nepal
-
 Netherlands
-
 New Zealand
-
 Nigeria
-
 North Macedonia
-
 Norway
-
 Oman
Oman
-
 Pakistan
-
 Palestine
-
 Panama
-
 Papua New Guinea
-
 Paraguay
-
 Peru
Peru
-
 Philippines
-
 Poland
-
 Portugal
-
 Puerto Rico
-
 Qatar
Qatar
-
 Reunion
-
 Romania
-
 Rwanda
-
 Saudi Arabia
-
 Serbia
-
 Singapore
-
 Slovakia
-
 Slovenia
-
 Somalia
-
 South Africa
-
 Spain
Spain
-
 Sri Lanka
-
 Sweden
-
 Switzerland
-
 Syria
Syria
-
 Taiwan
-
 Tajikistan
-
 Tanzania
-
 Thailand
-
 Trinidad and Tobago
-
 Tunisia
-
 Turkey
-
 UAE
UAE
-
 Uganda
-
 Ukraine
-
 United Kingdom
-
United States
-
 Uruguay
-
 Uzbekistan
-
 Venezuela
-
 Vietnam
-
 Yemen
Yemen
-
 Zambia
-
 Zimbabwe
- Forex
- Crypto











