
$8.4 resistance retested: Can QUBT break out and extend gains?

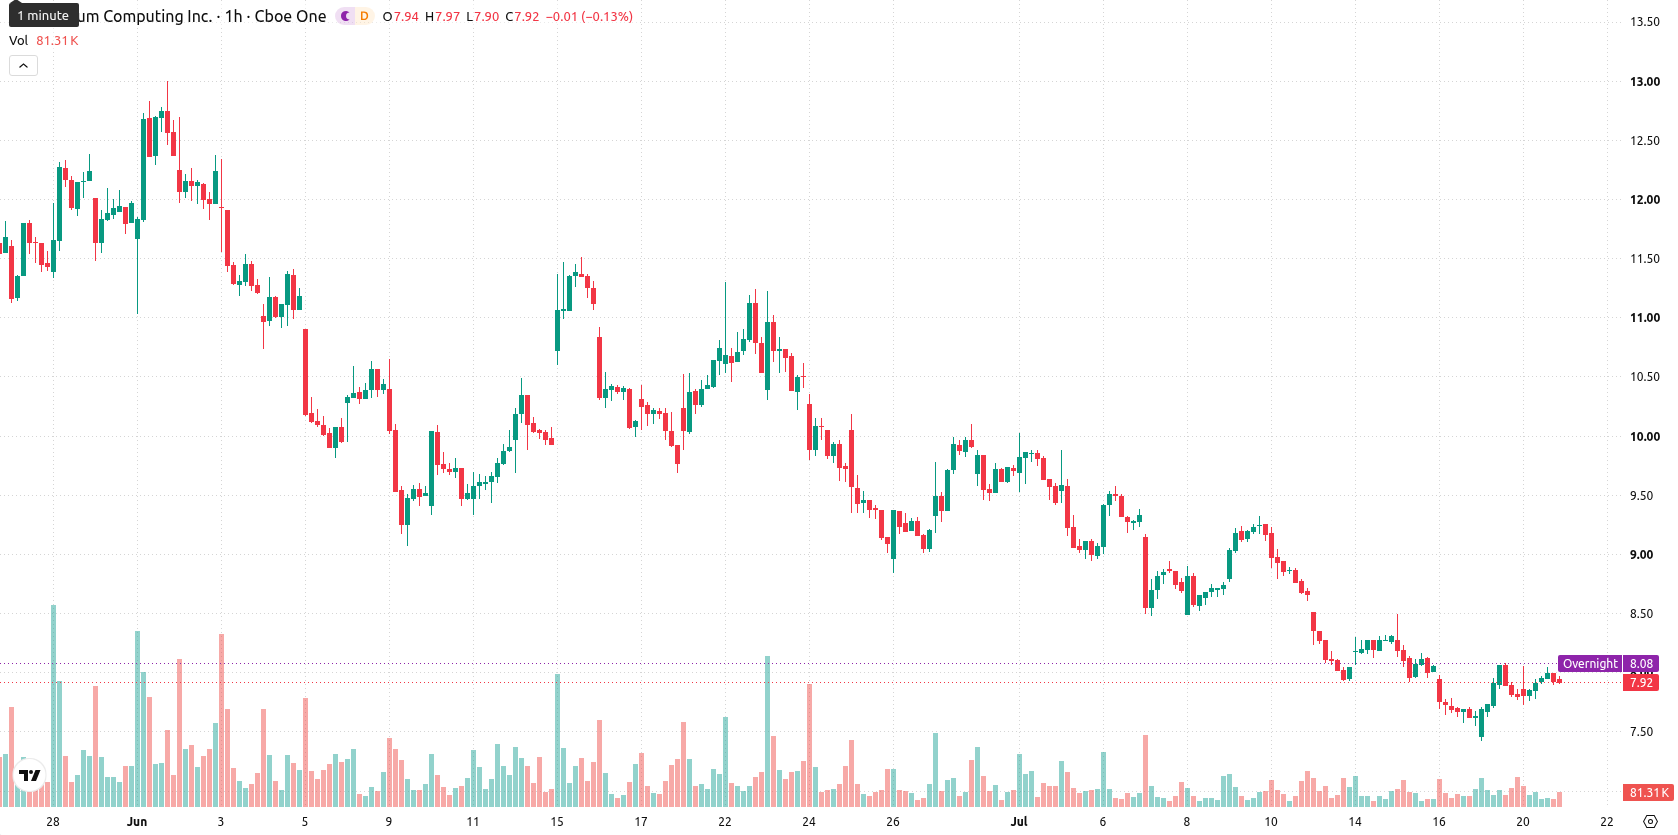
Quantum Computing (QUBT) stock is trading at $7.92 after gaining 1.54% on the day. The price closed above its key short-term averages while remaining below longer-term averages, indicating mixed trend signals.
 7.87
8.26
7.87
8.26
Highlights
- QUBT/USD shows short-term strength but remains in a bearish medium- and long-term trend below key resistance levels.
- Momentum indicators are mixed, with strong sell and overbought signals suggesting caution amid conflicting trend signals.
- Expected range for the next 2–3 days is $7.44 to $8.4, with downside risk favored at 65% probability.
Mixed momentum and resistance cap near-term upside
QUBT ended the session above the MA-20 at $7.81, but remains below both the MA-50 ($8.12) and MA-200 ($10.91). The Ichimoku Kijun level at $7.79 is providing immediate support. Among the main momentum indicators, MACD signals Strong Sell and ADX is Neutral, indicating no trend dominance. RSI sits at 48.74 with a Sell reading, Stoch RSI is Overbought, and CCI issues a Buy, while Bull/Bear Power reflects buyer dominance in intraday activity. The Awesome Oscillator is Neutral, and overall momentum readings are mixed, suggesting traders should remain cautious in the near term.
Sideways outlook as bearish bias outweighs breakout risk
Over the next two to three trading sessions, QUBT is likely to remain within a typical volatility band of $7.44 to $8.4. The probability of an upward break is 35%, while a downward move is more likely at 65%. The baseline scenario anticipates sideways movement within this corridor, with a bullish breakout possible if resistance at $8.4 is surpassed and a bearish scenario unfolding if the stock drops below immediate support at $7.44.
Earlier, analysts noted that Quantum Computing stock was contending with persistent bearish momentum despite some signs of buyer interest. The latest price action and momentum indicators highlight a more mixed outlook, making a break above $8.4 or below $7.44 pivotal for signaling the next directional move.


Latest Quantum Computing News





-
 Afghanistan
-
 Albania
-
 Algeria
-
 Angola
-
 Argentina
-
 Armenia
-
 Australia
-
 Austria
-
 Azerbaijan
-
 Bahamas
-
 Bahrain
-
 Bangladesh
-
 Belarus
-
 Belgium
-
 Bolivia
-
 Botswana
-
 Brazil
-
 Brunei
-
 Bulgaria
-
 Cambodia
-
 Cameroon
-
 Canada
-
 Chile
Chile
-
 China
China
-
 Colombia
-
 Congo
Congo
-
 Costa Rica
-
 Cote d'Ivoire
-
 Croatia
-
 Cuba
Cuba
-
 Cyprus
-
 Czechia
-
 DR Congo
-
 Denmark
-
 Dominican Republic
-
 Ecuador
-
 Egypt
Egypt
-
 El Salvador
-
 Estonia
-
 Eswatini
-
 Ethiopia
-
 Finland
-
 France
-
 Georgia
-
 Germany
-
 Ghana
Ghana
-
 Greece
-
 Haiti
Haiti
-
 Hong Kong
-
 Hungary
-
 India
India
-
 Indonesia
-
 Iran, Islamic republic
-
 Iraq
Iraq
-
 Ireland
-
 Israel
-
 Italy
Italy
-
 Jamaica
-
 Japan
Japan
-
 Jordan
-
 Kazakhstan
-
 Kenya
Kenya
-
 Korea
Korea
-
 Kuwait
-
 Kyrgyzstan
-
 Laos
Laos
-
 Latvia
-
 Lebanon
-
 Lesotho
-
 Libya
Libya
-
 Lithuania
-
 Luxembourg
-
 Madagascar
-
 Malaysia
-
 Malta
Malta
-
 Mauritius
-
 Mexico
-
 Moldova
-
 Mongolia
-
 Montenegro
-
 Morocco
-
 Mozambique
-
 Myanmar
-
 Namibia
-
 Nepal
Nepal
-
 Netherlands
-
 New Zealand
-
 Nigeria
-
 North Macedonia
-
 Norway
-
 Oman
Oman
-
 Pakistan
-
 Palestine
-
 Panama
-
 Papua New Guinea
-
 Paraguay
-
 Peru
Peru
-
 Philippines
-
 Poland
-
 Portugal
-
 Puerto Rico
-
 Qatar
Qatar
-
 Reunion
-
 Romania
-
 Rwanda
-
 Saudi Arabia
-
 Serbia
-
 Singapore
-
 Slovakia
-
 Slovenia
-
 Somalia
-
 South Africa
-
 Spain
Spain
-
 Sri Lanka
-
 Sweden
-
 Switzerland
-
 Syria
Syria
-
 Taiwan
-
 Tajikistan
-
 Tanzania
-
 Thailand
-
 Trinidad and Tobago
-
 Tunisia
-
 Turkey
-
 UAE
UAE
-
 Uganda
-
 Ukraine
-
 United Kingdom
-
United States
-
 Uruguay
-
 Uzbekistan
-
 Venezuela
-
 Vietnam
-
 Yemen
Yemen
-
 Zambia
-
 Zimbabwe
- Forex
- Crypto












