
Why is Texas Instruments stock down today? Key support levels to watch

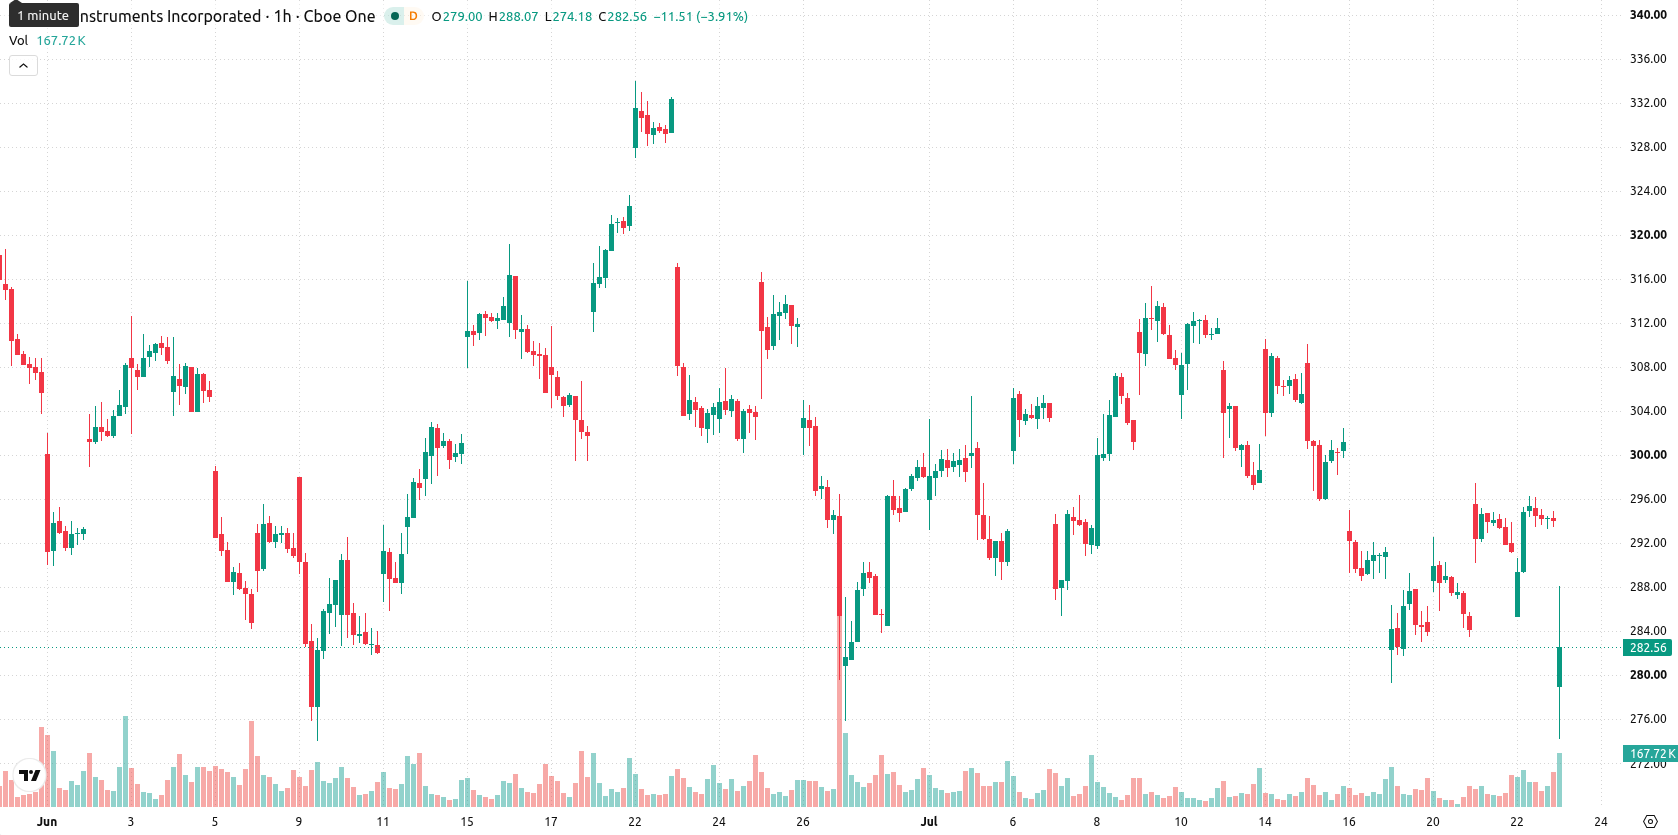
Texas Instruments (TXN) stock is trading at $282.67, ending the session down 3.92% on the day. The price sits below key short- and medium-term moving averages but is still positioned above major long-term averages.
 282.02
297.59
282.02
297.59
Highlights
- Texas Instruments posted Q2 revenue of $5.46 billion with net income of $1.98 billion and EPS of $2.14, signaling stable fundamental performance.
- A quarterly dividend of $1.42 per share was announced, reaffirming the company's ongoing capital return commitment to shareholders.
- TXN trades below key short- and medium-term moving averages with dominant seller momentum, and the price is likely to remain rangebound between $275.64 and $289.70 in the short term.
Broader selling pressure despite earnings and dividend support
Texas Instruments released its second quarter 2026 financial results, reporting revenue of $5.46 billion, net income of $1.98 billion, and earnings per share of $2.14, according to Finance Yahoo. This disclosure provides investors with the latest view of operational performance and forms a basis for fundamental assessment. The board also declared a quarterly cash dividend of $1.42 per share of common stock, offering a direct return to shareholders. Although these events are fundamentally supportive, price action has remained under broader selling pressure.
Mixed momentum as oversold signals clash with bullish MACD
On the technical front, TXN is trading below the MA-20 at $291.36 and MA-50 at $293.15 on the hourly chart, while still holding above the long-term MA-200 at $222.99. The daily Ichimoku Kijun line at $290.27 is acting as the nearest resistance. MACD is showing strong bullish momentum, whereas ADX remains neutral and does not confirm clear trend strength. Meanwhile, RSI, Stoch RSI, CCI, and Bull/Bear Power all indicate oversold conditions with active seller dominance over intraday momentum. The Awesome Oscillator prints a neutral reading, with the price closing near today's session low and exhibiting a pronounced $8.35 gap down amid increased volatility. Overall, this mixed set of signals points to unresolved short-term direction.
Rangebound outlook as downside risk outweighs breakout odds
For the near term, TXN is expected to fluctuate within a price range of $275.64 to $289.7, reflecting the typical volatility band relative to current levels. With a probability of 29% assigned to an upward move versus 71% for a continued decline, the baseline expectation is for the stock to remain rangebound inside these levels. An upward scenario would depend on a decisive move above immediate resistance, while a break below $275.64 could open the door to further downside.
Earlier, analysts noted that caution was mounting in semiconductor stocks as investors awaited key earnings reports and weighed elevated market risks. The latest results and technical signals in Texas Instruments reinforce this sentiment, highlighting the importance of watching for a decisive move above resistance or a breakdown below $275.64 to signal the next directional shift.


Latest Texas Instruments News







-
 Afghanistan
-
 Albania
-
 Algeria
-
 Angola
-
 Argentina
-
 Armenia
-
 Australia
-
 Austria
-
 Azerbaijan
-
 Bahamas
-
 Bahrain
-
 Bangladesh
-
 Belarus
-
 Belgium
-
 Bolivia
-
 Botswana
-
 Brazil
-
 Brunei
-
 Bulgaria
-
 Cambodia
-
 Cameroon
-
 Canada
-
 Chile
Chile
-
 China
China
-
 Colombia
-
 Congo
Congo
-
 Costa Rica
-
 Cote d'Ivoire
-
 Croatia
-
 Cuba
Cuba
-
 Cyprus
-
 Czechia
-
 DR Congo
-
 Denmark
-
 Dominican Republic
-
 Ecuador
-
 Egypt
Egypt
-
 El Salvador
-
 Estonia
-
 Eswatini
-
 Ethiopia
-
 Finland
-
 France
-
 Georgia
-
 Germany
-
 Ghana
Ghana
-
 Greece
-
 Haiti
Haiti
-
 Hong Kong
-
 Hungary
-
 India
India
-
 Indonesia
-
 Iran, Islamic republic
-
 Iraq
Iraq
-
 Ireland
-
 Israel
-
 Italy
Italy
-
 Jamaica
-
 Japan
Japan
-
 Jordan
-
 Kazakhstan
-
 Kenya
Kenya
-
 Korea
Korea
-
 Kuwait
-
 Kyrgyzstan
-
 Laos
Laos
-
 Latvia
-
 Lebanon
-
 Lesotho
-
 Libya
Libya
-
 Lithuania
-
 Luxembourg
-
 Madagascar
-
 Malaysia
-
 Malta
Malta
-
 Mauritius
-
 Mexico
-
 Moldova
-
 Mongolia
-
 Montenegro
-
 Morocco
-
 Mozambique
-
 Myanmar
-
 Namibia
-
 Nepal
Nepal
-
 Netherlands
-
 New Zealand
-
 Nigeria
-
 North Macedonia
-
 Norway
-
 Oman
Oman
-
 Pakistan
-
 Palestine
-
 Panama
-
 Papua New Guinea
-
 Paraguay
-
 Peru
Peru
-
 Philippines
-
 Poland
-
 Portugal
-
 Puerto Rico
-
 Qatar
Qatar
-
 Reunion
-
 Romania
-
 Rwanda
-
 Saudi Arabia
-
 Serbia
-
 Singapore
-
 Slovakia
-
 Slovenia
-
 Somalia
-
 South Africa
-
 Spain
Spain
-
 Sri Lanka
-
 Sweden
-
 Switzerland
-
 Syria
Syria
-
 Taiwan
-
 Tajikistan
-
 Tanzania
-
 Thailand
-
 Trinidad and Tobago
-
 Tunisia
-
 Turkey
-
 UAE
UAE
-
 Uganda
-
 Ukraine
-
 United Kingdom
-
United States
-
 Uruguay
-
 Uzbekistan
-
 Venezuela
-
 Vietnam
-
 Yemen
Yemen
-
 Zambia
-
 Zimbabwe
- Forex
- Crypto












