
Why is Texas Instruments stock rising today? Quarterly dividend and resistance levels in focus

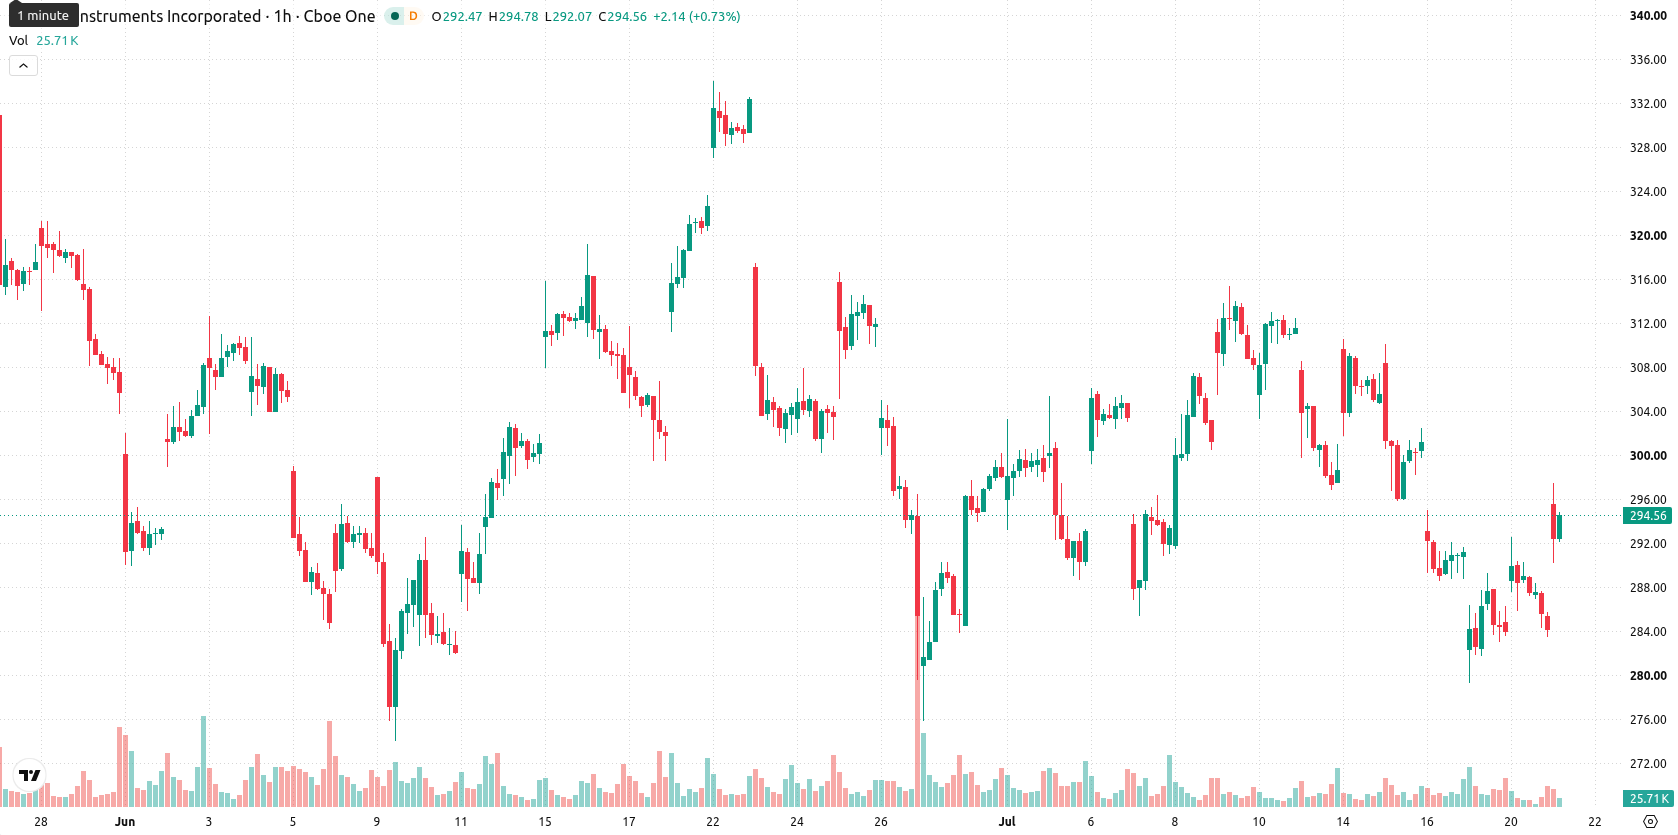
Texas Instruments (TXN) stock is trading at $294.09, up 3.49% for the day, which places it above its key short-term averages while remaining just below medium-term levels. The price is holding near session highs, reflecting sustained buying interest throughout the session.
 282.60
297.59
282.60
297.59
Highlights
- Texas Instruments reports earnings Wednesday after the bell, drawing heightened trader attention to revenue, margins, and outlook.
- A newly declared $1.42 quarterly dividend, payable August 2026, signals continued shareholder returns and long-term value focus.
- Technical signals are mixed with overbought conditions and momentum divergence; price is expected to range between $280.61 and $307.57, with a 62% probability of downward movement.
Earnings anticipation and dividend outlook fuel repositioning in TXN
Anticipation is building ahead of Texas Instruments’ upcoming quarterly earnings report, which is slated for release this Wednesday after the bell, according to Finance Yahoo. Such scheduled earnings releases typically increase trader activity, as market participants reposition based on expectations for revenue, margins, and future guidance. In addition, the company’s recently declared quarterly dividend of $1.42 per share—payable August 11, 2026 to shareholders of record as of July 31, 2026—further underscores its ongoing commitment to rewarding shareholders and supports a long-term value narrative.
Mixed signals emerge as TXN tests resistance amid overbought readings
On the technical front, TXN trades above its MA-20 but just below the MA-50 on the 1-hour chart, while standing well above the MA-200 on the daily chart. The Ichimoku Kijun level at $290.59 serves as immediate support. Key indicators are mixed: the MACD signals Strong Sell while ADX is Neutral, showing lack of strong directional conviction. RSI remains in a Buy zone, but Stoch RSI, CCI, and Bull/Bear Power all reflect overbought readings, indicating robust buying activity but warning of possible short-term exhaustion.
Downside favored as volatility band guides near-term TXN direction
Over the next several trading days, TXN is likely to fluctuate within the $280.61 to $307.57 range, reflecting the asset’s typical volatility band. Current probabilities favor a downside move at 62%, versus a 38% likelihood of a bullish advance. If price consolidates, expect continued range-bound action; an upward breakout above resistance would indicate renewed momentum, while a drop below immediate support would trigger a bearish scenario.
Earlier, analysts noted that Texas Instruments was facing prevailing bearish momentum, underpinned by sector volatility and cautious technical signals despite ongoing dividend stability. The latest price action, marked by a rebound above short-term averages and ahead of a closely watched earnings release, introduces heightened event-driven risk, making the immediate support at the Ichimoku Kijun a critical level to monitor for a potential shift in directional bias.


Latest Texas Instruments News







-
 Afghanistan
-
 Albania
-
 Algeria
-
 Angola
-
 Argentina
-
 Armenia
-
 Australia
-
 Austria
-
 Azerbaijan
-
 Bahamas
-
 Bahrain
-
 Bangladesh
-
 Belarus
-
 Belgium
-
 Bolivia
-
 Botswana
-
 Brazil
-
 Brunei
-
 Bulgaria
-
 Cambodia
-
 Cameroon
-
 Canada
-
 Chile
Chile
-
 China
China
-
 Colombia
-
 Congo
Congo
-
 Costa Rica
-
 Cote d'Ivoire
-
 Croatia
-
 Cuba
Cuba
-
 Cyprus
-
 Czechia
-
 DR Congo
-
 Denmark
-
 Dominican Republic
-
 Ecuador
-
 Egypt
Egypt
-
 El Salvador
-
 Estonia
-
 Eswatini
-
 Ethiopia
-
 Finland
-
 France
-
 Georgia
-
 Germany
-
 Ghana
Ghana
-
 Greece
-
 Haiti
Haiti
-
 Hong Kong
-
 Hungary
-
 India
India
-
 Indonesia
-
 Iran, Islamic republic
-
 Iraq
Iraq
-
 Ireland
-
 Israel
-
 Italy
Italy
-
 Jamaica
-
 Japan
Japan
-
 Jordan
-
 Kazakhstan
-
 Kenya
Kenya
-
 Korea
Korea
-
 Kuwait
-
 Kyrgyzstan
-
 Laos
Laos
-
 Latvia
-
 Lebanon
-
 Lesotho
-
 Libya
Libya
-
 Lithuania
-
 Luxembourg
-
 Madagascar
-
 Malaysia
-
 Malta
Malta
-
 Mauritius
-
 Mexico
-
 Moldova
-
 Mongolia
-
 Montenegro
-
 Morocco
-
 Mozambique
-
 Myanmar
-
 Namibia
-
 Nepal
Nepal
-
 Netherlands
-
 New Zealand
-
 Nigeria
-
 North Macedonia
-
 Norway
-
 Oman
Oman
-
 Pakistan
-
 Palestine
-
 Panama
-
 Papua New Guinea
-
 Paraguay
-
 Peru
Peru
-
 Philippines
-
 Poland
-
 Portugal
-
 Puerto Rico
-
 Qatar
Qatar
-
 Reunion
-
 Romania
-
 Rwanda
-
 Saudi Arabia
-
 Serbia
-
 Singapore
-
 Slovakia
-
 Slovenia
-
 Somalia
-
 South Africa
-
 Spain
Spain
-
 Sri Lanka
-
 Sweden
-
 Switzerland
-
 Syria
Syria
-
 Taiwan
-
 Tajikistan
-
 Tanzania
-
 Thailand
-
 Trinidad and Tobago
-
 Tunisia
-
 Turkey
-
 UAE
UAE
-
 Uganda
-
 Ukraine
-
 United Kingdom
-
United States
-
 Uruguay
-
 Uzbekistan
-
 Venezuela
-
 Vietnam
-
 Yemen
Yemen
-
 Zambia
-
 Zimbabwe
- Forex
- Crypto












