

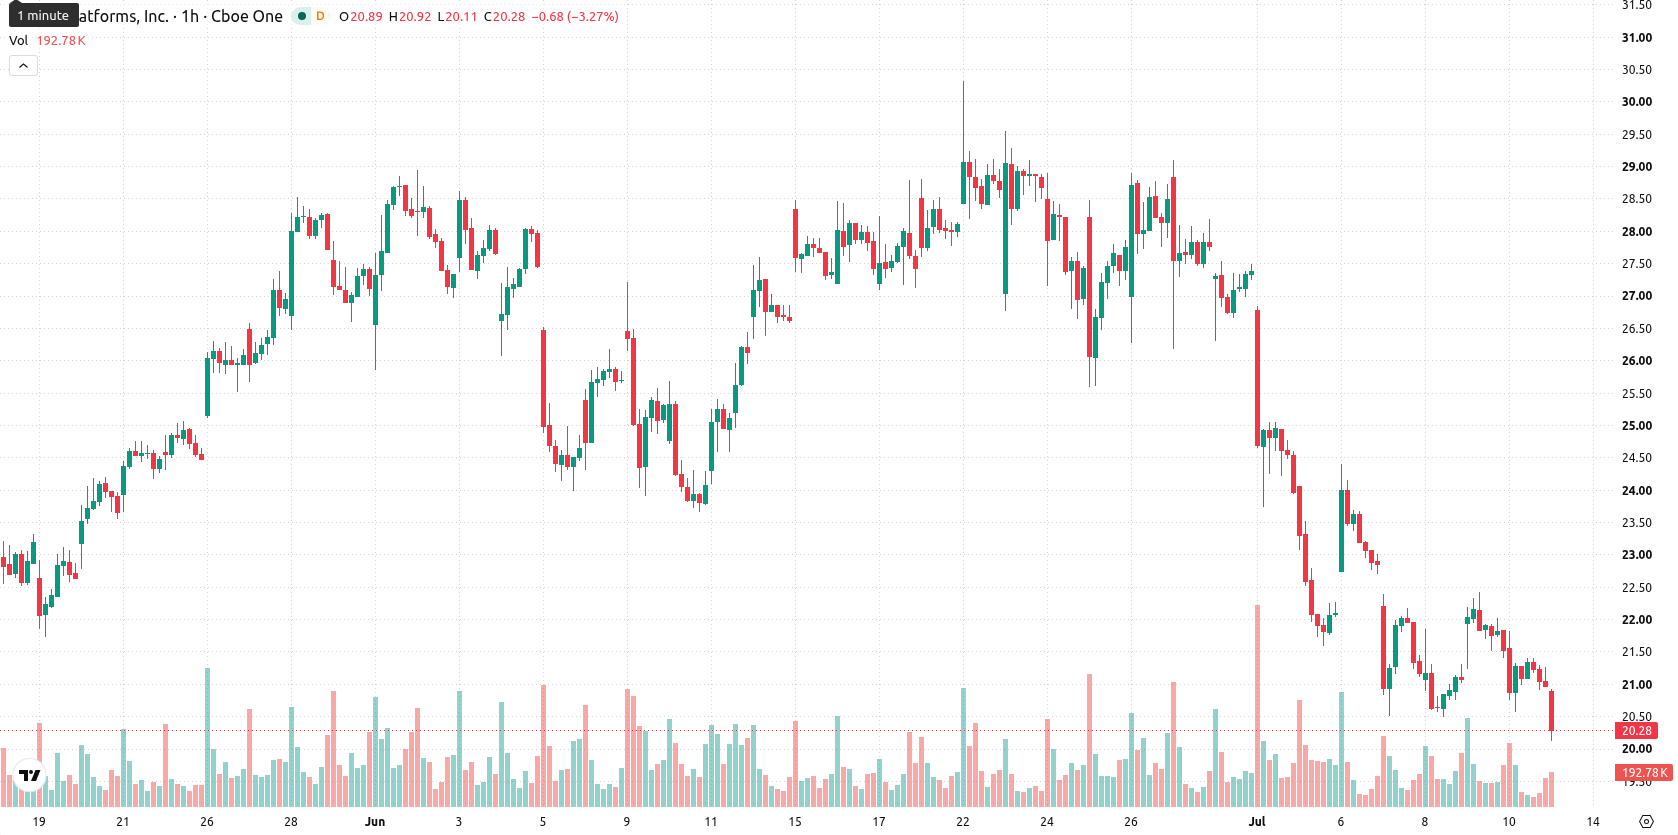
Riot Platforms (RIOT) stock is trading at $20.22, down 3.55% on the day. The shares are currently positioned below their key moving averages on short and medium timeframes, but remain supported on a longer-term basis.
 20.84
22.42
20.84
22.42
Highlights
- RIOT/USD faces sustained selling pressure as price trades below short- and medium-term moving averages with downward bias.
- Momentum indicators collectively signal strong bearishness and oversold conditions, supporting the dominant seller trend intraday.
- The expected range for the next 2–3 days is $19.35–$21.52, with a high probability of further downside unless price breaks above $21.45.
Oversold momentum aligns with multi-timeframe resistance pressure
On the technical side, RIOT/USD is trading below the 20-period moving average at $21.3 and the 50-period moving average at $22.2 on the hourly chart, while remaining above the 200-period moving average at $18.45 on the daily timeframe. The Ichimoku Kijun at $21.45 is acting as immediate resistance. Momentum indicators show pronounced seller dominance intraday: the Relative Strength Index (RSI) is at 36.76 (Sell), while the Moving Average Convergence Divergence (MACD) and Average Directional Index (ADX) both signal a sell. Stochastic RSI, Commodity Channel Index (CCI), and Bull/Bear Power are all oversold, collectively confirming strong downside pressure. The Awesome Oscillator does not support the prevailing trend.
Downside risk elevated as breakout probabilities diminish
In the short term, RIOT is expected to trade within the $19.35 to $21.52 range over the next two to three sessions. The probability of an upward breakout is considered very low, with a high chance of further declines if weakness persists. Should the price consolidate within this band, sideways movement is likely. A move above $21.45 would indicate initial bullish interest, while a drop below $19.35 would confirm a bearish scenario and open the way for additional declines.
Earlier, analysts noted that Riot Platforms faced sustained downside risk amid prevailing bearish momentum and mixed short-term technical signals. The latest data further reinforces this outlook, so traders should closely monitor for a confirmed breakdown below the $19.35 support as this could accelerate volatility-driven declines in the sessions ahead.







-
 Afghanistan
-
 Albania
-
 Algeria
-
 Angola
-
 Argentina
-
 Armenia
-
 Australia
-
 Austria
-
 Azerbaijan
-
 Bahamas
-
 Bahrain
-
 Bangladesh
-
 Belarus
-
 Belgium
-
 Bolivia
-
 Botswana
-
 Brazil
-
 Brunei
-
 Bulgaria
-
 Cambodia
-
 Cameroon
-
 Canada
-
 Chile
Chile
-
 China
China
-
 Colombia
-
 Congo
Congo
-
 Costa Rica
-
 Cote d'Ivoire
-
 Croatia
-
 Cuba
Cuba
-
 Cyprus
-
 Czechia
-
 DR Congo
-
 Denmark
-
 Dominican Republic
-
 Ecuador
-
 Egypt
Egypt
-
 El Salvador
-
 Estonia
-
 Eswatini
-
 Ethiopia
-
 Finland
-
 France
-
 Georgia
-
 Germany
-
 Ghana
Ghana
-
 Greece
-
 Haiti
Haiti
-
 Hong Kong
-
 Hungary
-
 India
India
-
 Indonesia
-
 Iran, Islamic republic
-
 Iraq
Iraq
-
 Ireland
-
 Israel
-
 Italy
Italy
-
 Jamaica
-
 Japan
Japan
-
 Jordan
-
 Kazakhstan
-
 Kenya
Kenya
-
 Korea
Korea
-
 Kuwait
-
 Kyrgyzstan
-
 Laos
Laos
-
 Latvia
-
 Lebanon
-
 Lesotho
-
 Libya
Libya
-
 Lithuania
-
 Luxembourg
-
 Madagascar
-
 Malaysia
-
 Malta
Malta
-
 Mauritius
-
 Mexico
-
 Moldova
-
 Mongolia
-
 Montenegro
-
 Morocco
-
 Mozambique
-
 Myanmar
-
 Namibia
-
 Nepal
Nepal
-
 Netherlands
-
 New Zealand
-
 Nigeria
-
 North Macedonia
-
 Norway
-
 Oman
Oman
-
 Pakistan
-
 Palestine
-
 Panama
-
 Papua New Guinea
-
 Paraguay
-
 Peru
Peru
-
 Philippines
-
 Poland
-
 Portugal
-
 Puerto Rico
-
 Qatar
Qatar
-
 Reunion
-
 Romania
-
 Rwanda
-
 Saudi Arabia
-
 Serbia
-
 Singapore
-
 Slovakia
-
 Slovenia
-
 Somalia
-
 South Africa
-
 Spain
Spain
-
 Sri Lanka
-
 Sweden
-
 Switzerland
-
 Syria
Syria
-
 Taiwan
-
 Tajikistan
-
 Tanzania
-
 Thailand
-
 Trinidad and Tobago
-
 Tunisia
-
 Turkey
-
 UAE
UAE
-
 Uganda
-
 Ukraine
-
 United Kingdom
-
United States
-
 Uruguay
-
 Uzbekistan
-
 Venezuela
-
 Vietnam
-
 Yemen
Yemen
-
 Zambia
-
 Zimbabwe
- Forex
- Crypto











