
PEP shares consolidate near $139 facing resistance at MA-50: weekly forecast

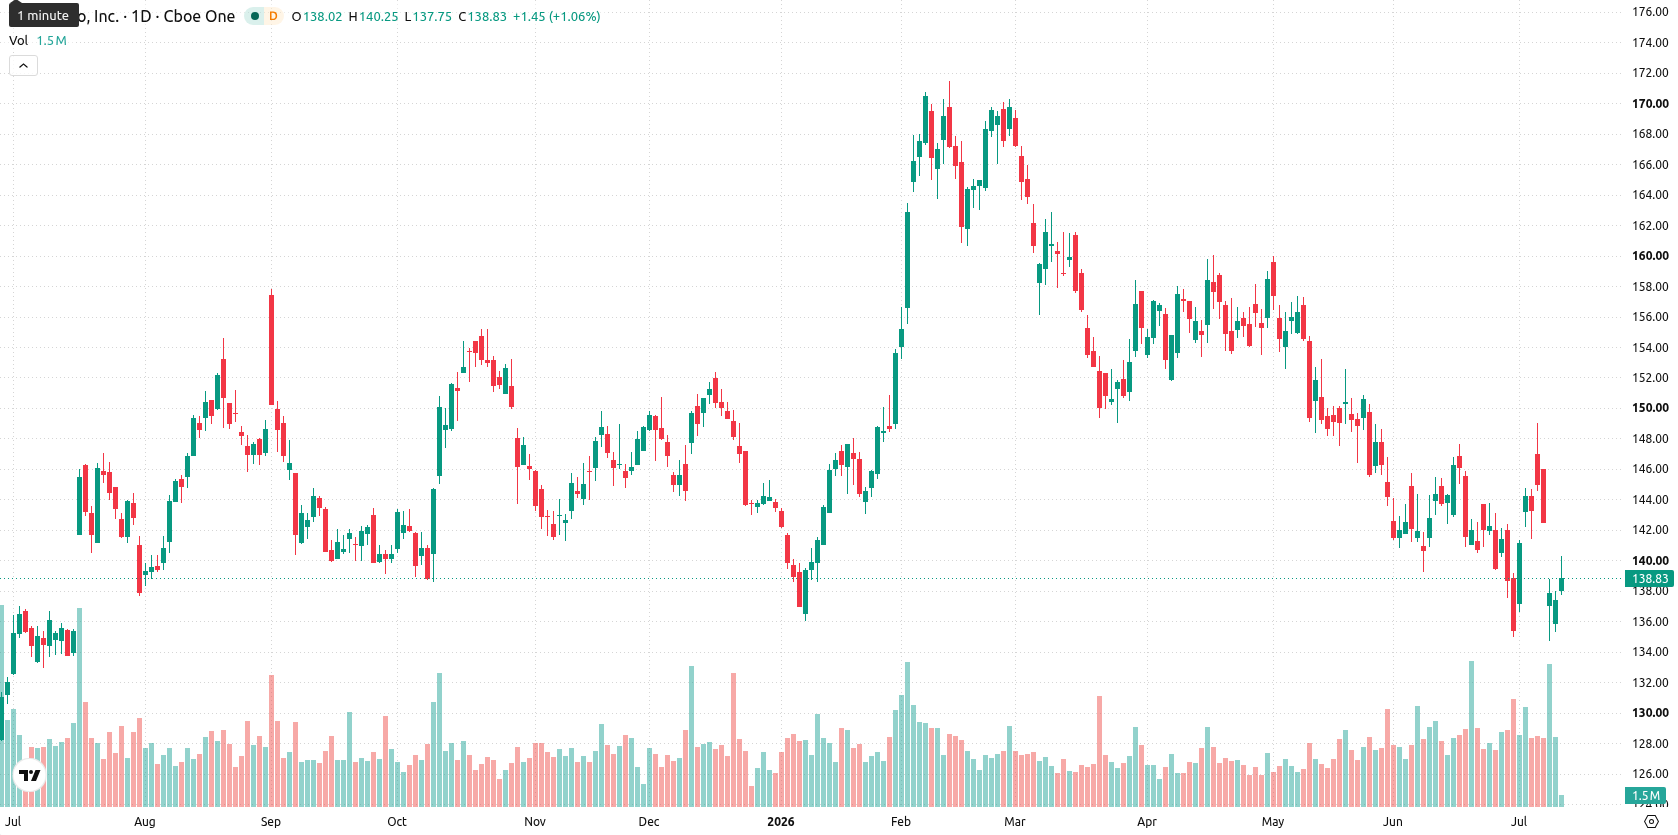
PepsiCo, Inc. (PEP) is currently trading at $138.96, posting a weekly gain of $1.58, or 1.18%, from last week’s close. The asset remains well below its key weekly moving averages (MA-20 at $151.32, MA-50 at $149.48, and MA-200 at $162.67), indicating persistent selling pressure across medium- and long-term timeframes.
 139.78
149.04
139.78
149.04
Highlights
- PepsiCo is trading well below key moving averages, indicating persistent medium- and long-term bearish momentum.
- Momentum indicators remain negative and oversold, suggesting continued downside risk despite a brief weekly rebound.
- Expected range for the next seven days is $138.00 to $144.00, with sideways action most likely and a break below $138.00 opening further downside.
Mixed quarterly results and dividend hike drive cautious sentiment
PepsiCo reported mixed second-quarter results, with strong international demand partially offsetting weaker performance in North America. The company maintained its track record for shareholder returns by marking its 54th consecutive annual dividend increase, and set full-year 2026 earnings guidance between $8.55 and $8.71 per share. Some institutional investors trimmed positions in PEP during the first quarter, while the company continues to benefit from its global business and dividend consistency.
Bearish momentum dominates as technical signals point to oversold
Weekly technical analysis shows PEP trading well below its MA-20, MA-50, and MA-200, with the MA-50 likely to act as dynamic resistance. The weekly RSI remains below neutral and signals oversold conditions, which is confirmed by the Stochastic RSI and CCI, while the MACD and ADX also indicate weak and negative momentum. Weekly volatility is elevated at 10.65%, and Bull/Bear Power suggests some short-term buyer activity, but the overall picture is still dominated by bearish momentum signals.
Range-bound outlook next week amid low breakout probability
For the next 5 trading days, PEP is expected to trade in a narrow range between $138.00 and $144.00, based on recent volatility and current technical signals. The probability of a significant upward move remains low (less than 20%), as none of the four key weekly indicators suggest a buy setup. The baseline scenario calls for price action to oscillate between $138.00 and $141.00, with a bullish breakout above $144.00 opening a retest of resistance, while a drop below $138.00 could invite further downside toward the year's lows.
Earlier, analysts noted that persistent bearish momentum and technical weakness continued to weigh on PepsiCo shares despite pockets of buyer activity. Current weekly indicators reinforce this view, with the outlook now focused on whether price can sustain above $138.00 to avoid triggering further downside risk in the coming sessions.







-
 Afghanistan
-
 Albania
-
 Algeria
-
 Angola
-
 Argentina
-
 Armenia
-
 Australia
-
 Austria
-
 Azerbaijan
-
 Bahamas
-
 Bahrain
-
 Bangladesh
-
 Belarus
-
 Belgium
-
 Bolivia
-
 Botswana
-
 Brazil
-
 Brunei
-
 Bulgaria
-
 Cambodia
-
 Cameroon
-
 Canada
-
 Chile
Chile
-
 China
China
-
 Colombia
-
 Congo
Congo
-
 Costa Rica
-
 Cote d'Ivoire
-
 Croatia
-
 Cuba
Cuba
-
 Cyprus
-
 Czechia
-
 DR Congo
-
 Denmark
-
 Dominican Republic
-
 Ecuador
-
 Egypt
Egypt
-
 El Salvador
-
 Estonia
-
 Eswatini
-
 Ethiopia
-
 Finland
-
 France
-
 Georgia
-
 Germany
-
 Ghana
Ghana
-
 Greece
-
 Haiti
Haiti
-
 Hong Kong
-
 Hungary
-
 India
India
-
 Indonesia
-
 Iran, Islamic republic
-
 Iraq
Iraq
-
 Ireland
-
 Israel
-
 Italy
Italy
-
 Jamaica
-
 Japan
Japan
-
 Jordan
-
 Kazakhstan
-
 Kenya
Kenya
-
 Korea
Korea
-
 Kuwait
-
 Kyrgyzstan
-
 Laos
Laos
-
 Latvia
-
 Lebanon
-
 Lesotho
-
 Libya
Libya
-
 Lithuania
-
 Luxembourg
-
 Madagascar
-
 Malaysia
-
 Malta
Malta
-
 Mauritius
-
 Mexico
-
 Moldova
-
 Mongolia
-
 Montenegro
-
 Morocco
-
 Mozambique
-
 Myanmar
-
 Namibia
-
 Nepal
Nepal
-
 Netherlands
-
 New Zealand
-
 Nigeria
-
 North Macedonia
-
 Norway
-
 Oman
Oman
-
 Pakistan
-
 Palestine
-
 Panama
-
 Papua New Guinea
-
 Paraguay
-
 Peru
Peru
-
 Philippines
-
 Poland
-
 Portugal
-
 Puerto Rico
-
 Qatar
Qatar
-
 Reunion
-
 Romania
-
 Rwanda
-
 Saudi Arabia
-
 Serbia
-
 Singapore
-
 Slovakia
-
 Slovenia
-
 Somalia
-
 South Africa
-
 Spain
Spain
-
 Sri Lanka
-
 Sweden
-
 Switzerland
-
 Syria
Syria
-
 Taiwan
-
 Tajikistan
-
 Tanzania
-
 Thailand
-
 Trinidad and Tobago
-
 Tunisia
-
 Turkey
-
 UAE
UAE
-
 Uganda
-
 Ukraine
-
 United Kingdom
-
United States
-
 Uruguay
-
 Uzbekistan
-
 Venezuela
-
 Vietnam
-
 Yemen
Yemen
-
 Zambia
-
 Zimbabwe
- Forex
- Crypto











