
INTU rallies as overbought conditions may cap further upside

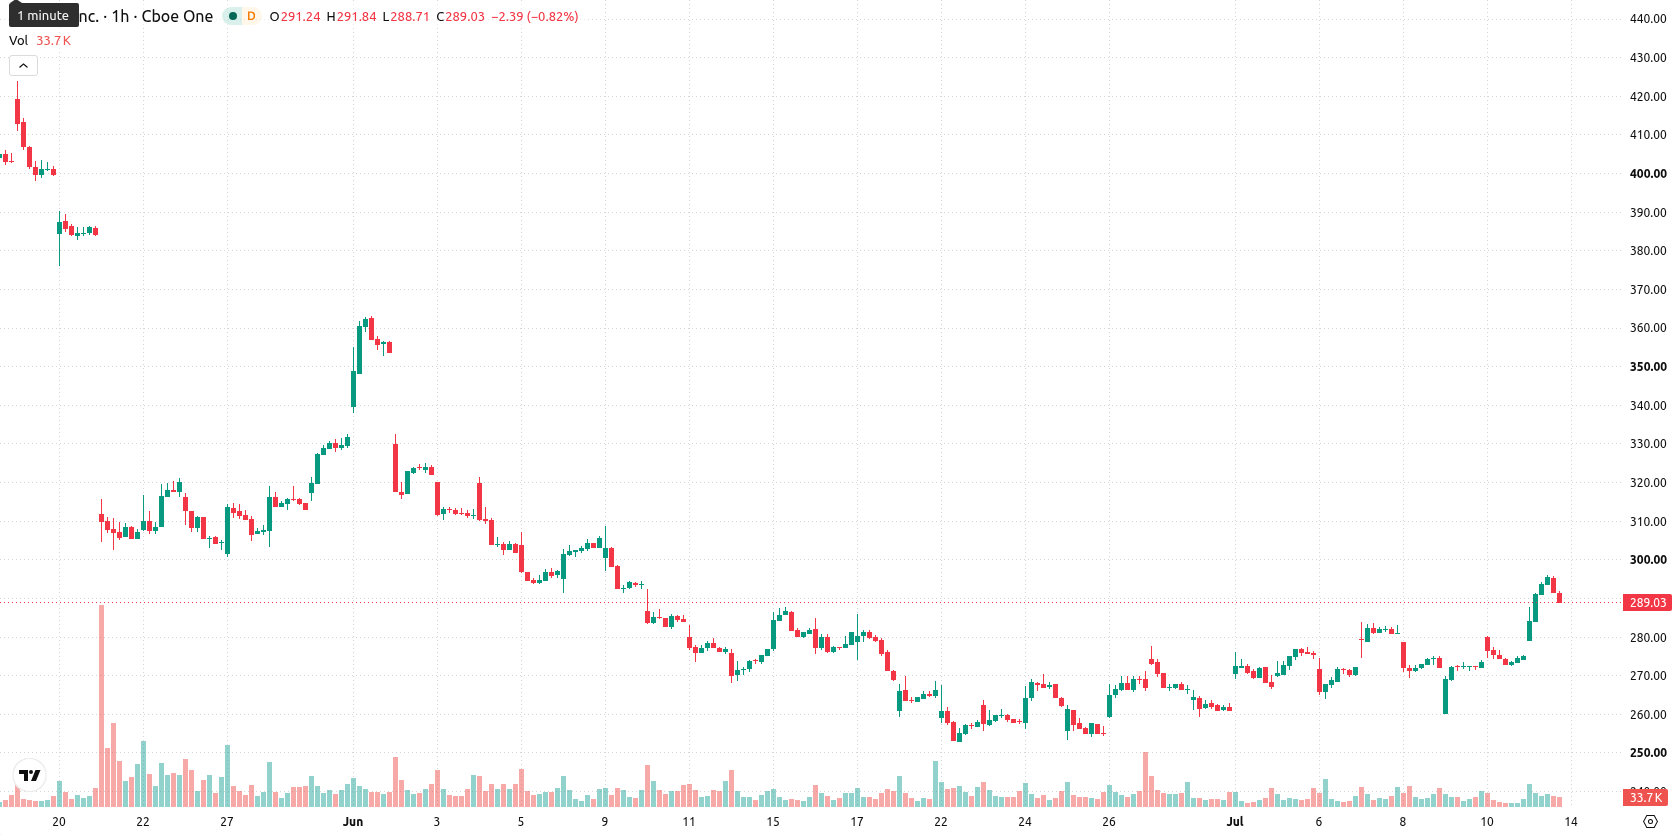
Intuit Inc. (INTU) stock is trading at $288.12, up 4.8% on the day with strong intraday volatility. The stock currently sits above its key moving averages, signaling robust short- and medium-term buying interest.
 296.00
283.79
296.00
283.79
Highlights
- Intuit faces a class action lawsuit alleging misleading statements on its competitive position and TurboTax revenue outlook, increasing legal and regulatory risk.
- Stock dropped 20% after weak tax season revenue, with a second securities fraud suit intensifying scrutiny of management's financial disclosures and governance.
- INTU trades with strong short-term buying momentum and high volatility, with a projected trading range of $277.2–$315.7 over the next 2–3 days.
Legal scrutiny escalates as investor trust faces governance challenges
A class action lawsuit was announced against Intuit Inc., alleging that the company made materially false and misleading statements about its competitive position, TurboTax revenue outlook, and business sustainability in the period up to May 20, 2026, according to Prnewswire. This disclosure, which cited weak tax season revenue and a sharp drop in stock price, has raised legal risks and may prompt investors to question management's past disclosures, creating a reassessment of governance standards. In addition, a separate securities fraud lawsuit following the 20% stock decline compounds the focus on financial transparency and could shape broader investor sentiment in the near term.
Mixed momentum as short-term strength collides with overbought signals
On the technical side, INTU is trading above its $278.63 MA-20 and $275.9 MA-50 on the hourly chart, while it remains below the long-term MA-200 at $495.3 on the daily timeframe. The Ichimoku Kijun level at $277.69 acts as immediate support. Momentum readings show the Moving Average Convergence Divergence (MACD) and Awesome Oscillator both on Buy, whereas the Average Directional Index (ADX) is Neutral, reflecting a lack of dominant trend strength. The Relative Strength Index (RSI) stands at a high 69.52 and the Commodity Channel Index (CCI) is Overbought, both signaling stretched conditions, while Bull/Bear Power is also Overbought. Stochastic RSI and ADX remain Neutral, highlighting a moderate divergence between strong upward momentum and some overextended signals.
Upside bias as volatility shapes near-term consolidation risk
Over the next 2–3 trading days, the expected price range for INTU is $277.2 to $315.7, reflecting typical volatility for current conditions. There is a 74% probability of an upward move, while downside risk is seen as less likely. The base case scenario is for price to consolidate between established support and resistance, though a break above the range could open up further upside, whereas loss of support may accelerate downward pressure.
Earlier, analysts noted that strong earnings momentum and analyst support were key drivers of outperformance among top S&P 500 stocks. The recent emergence of legal risks and heightened scrutiny of Intuit's disclosures adds a new dimension to the outlook, making technical levels such as the $277.69 support especially critical for traders watching for a potential shift in short-term sentiment.


Latest Intuit News







-
 Afghanistan
-
 Albania
-
 Algeria
-
 Angola
-
 Argentina
-
 Armenia
-
 Australia
-
 Austria
-
 Azerbaijan
-
 Bahamas
-
 Bahrain
-
 Bangladesh
-
 Belarus
-
 Belgium
-
 Bolivia
-
 Botswana
-
 Brazil
-
 Brunei
-
 Bulgaria
-
 Cambodia
-
 Cameroon
-
 Canada
-
 Chile
Chile
-
 China
China
-
 Colombia
-
 Congo
Congo
-
 Costa Rica
-
 Cote d'Ivoire
-
 Croatia
-
 Cuba
Cuba
-
 Cyprus
-
 Czechia
-
 DR Congo
-
 Denmark
-
 Dominican Republic
-
 Ecuador
-
 Egypt
Egypt
-
 El Salvador
-
 Estonia
-
 Eswatini
-
 Ethiopia
-
 Finland
-
 France
-
 Georgia
-
 Germany
-
 Ghana
Ghana
-
 Greece
-
 Haiti
Haiti
-
 Hong Kong
-
 Hungary
-
 India
India
-
 Indonesia
-
 Iran, Islamic republic
-
 Iraq
Iraq
-
 Ireland
-
 Israel
-
 Italy
Italy
-
 Jamaica
-
 Japan
Japan
-
 Jordan
-
 Kazakhstan
-
 Kenya
Kenya
-
 Korea
Korea
-
 Kuwait
-
 Kyrgyzstan
-
 Laos
Laos
-
 Latvia
-
 Lebanon
-
 Lesotho
-
 Libya
Libya
-
 Lithuania
-
 Luxembourg
-
 Madagascar
-
 Malaysia
-
 Malta
Malta
-
 Mauritius
-
 Mexico
-
 Moldova
-
 Mongolia
-
 Montenegro
-
 Morocco
-
 Mozambique
-
 Myanmar
-
 Namibia
-
 Nepal
Nepal
-
 Netherlands
-
 New Zealand
-
 Nigeria
-
 North Macedonia
-
 Norway
-
 Oman
Oman
-
 Pakistan
-
 Palestine
-
 Panama
-
 Papua New Guinea
-
 Paraguay
-
 Peru
Peru
-
 Philippines
-
 Poland
-
 Portugal
-
 Puerto Rico
-
 Qatar
Qatar
-
 Reunion
-
 Romania
-
 Rwanda
-
 Saudi Arabia
-
 Serbia
-
 Singapore
-
 Slovakia
-
 Slovenia
-
 Somalia
-
 South Africa
-
 Spain
Spain
-
 Sri Lanka
-
 Sweden
-
 Switzerland
-
 Syria
Syria
-
 Taiwan
-
 Tajikistan
-
 Tanzania
-
 Thailand
-
 Trinidad and Tobago
-
 Tunisia
-
 Turkey
-
 UAE
UAE
-
 Uganda
-
 Ukraine
-
 United Kingdom
-
United States
-
 Uruguay
-
 Uzbekistan
-
 Venezuela
-
 Vietnam
-
 Yemen
Yemen
-
 Zambia
-
 Zimbabwe
- Forex
- Crypto











