

NNDM trades sideways as persistent selling pressure dominates action

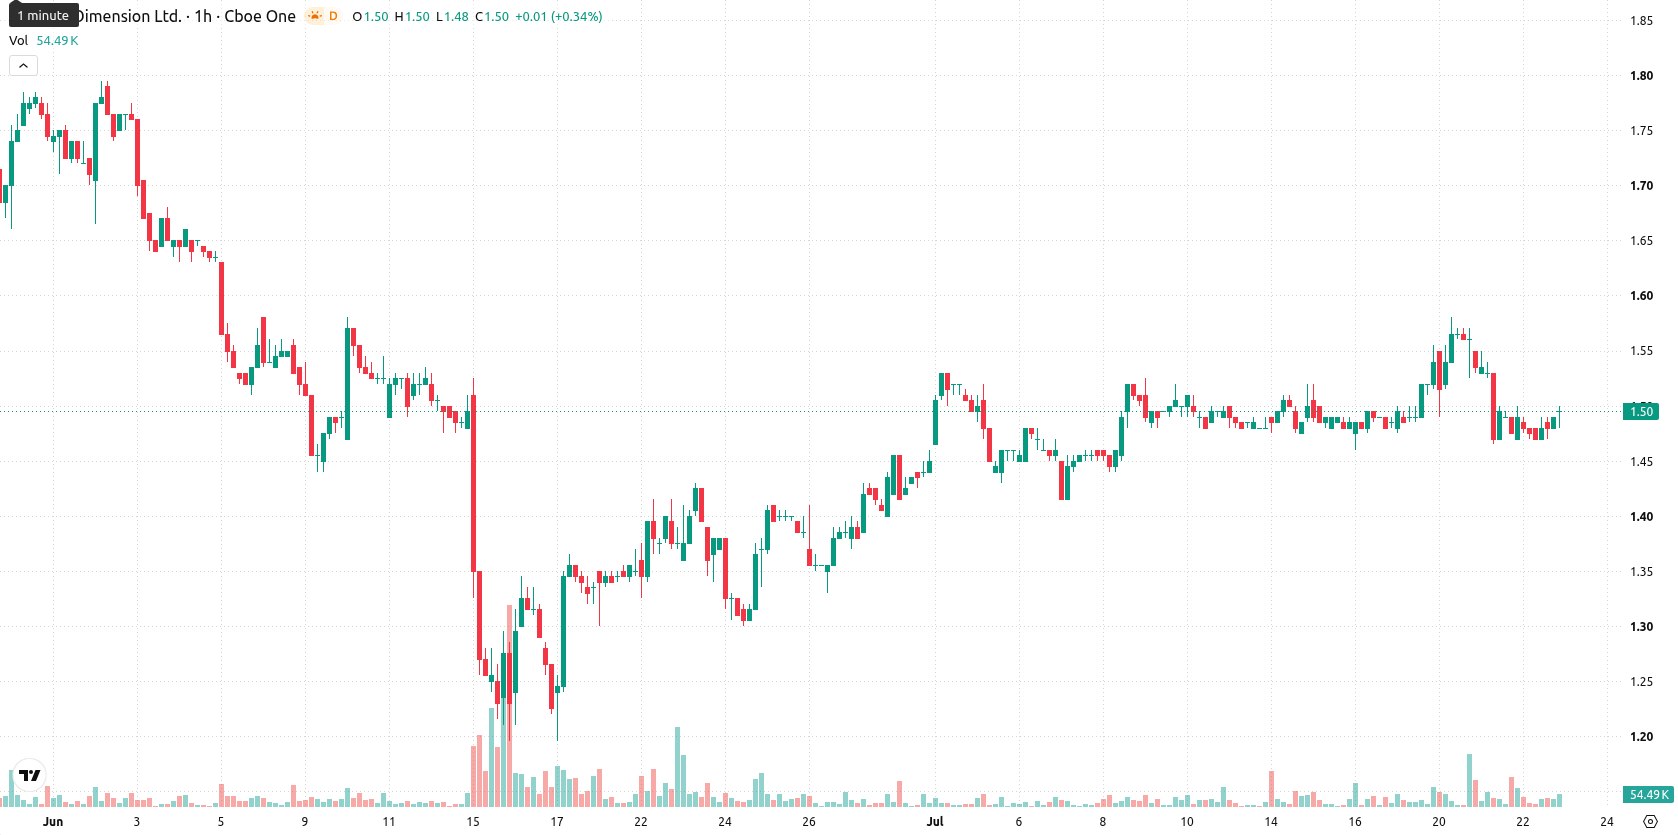
Nano Dimension (NNDM) stock is trading at $1.48 after a slight intraday dip. The price remains below its key moving averages, suggesting a mid-range position within ongoing market volatility.
 1.28
1.38
Highlights
- NNDM/USD is under sustained selling pressure, trading below key moving averages across all timeframes.
- Momentum and oscillators consistently indicate a bearish bias, with no signs of the asset being oversold.
- Price is expected to fluctuate between $1.43 and $1.53 over the next several days, with high risk of a downside break.
Bearish control as technical signals reinforce downside momentum
On the technical front, NNDM/USD is trading below its MA-20 and MA-50 on the hourly chart, while also positioned under the MA-200 on the daily timeframe. The Ichimoku Kijun acts as immediate resistance at $1.52. Momentum indicators such as MACD and ADX continue to reflect persistent selling pressure. RSI, Stoch RSI, and CCI all contribute to a downside bias, with Bull/Bear Power revealing sporadic buyer activity during intraday moves, but overall signaling bearish control.
Downside risk dominates as breakout odds remain limited
Looking ahead to the coming two to three trading days, NNDM is expected to trend sideways within a volatility band of $1.43 to $1.53. The probability of an upward breakout is considered very low, while further weakness carries a much higher likelihood. A potential bullish scenario would require a decisive close above the $1.52 resistance, but further declines could see support at $1.43 challenged.
Earlier, analysts noted that Nano Dimension was facing continued selling pressure amid a broadly bearish technical setup. Fresh momentum readings and persistently weak price action now reinforce the prevailing downside scenario, with traders watching for a potential test of lower support levels if bearish control persists in the coming sessions.






Latest Nano Dimension News




-
 Afghanistan
-
 Albania
-
 Algeria
-
 Angola
-
 Argentina
-
 Armenia
-
 Australia
-
 Austria
-
 Azerbaijan
-
 Bahamas
-
 Bahrain
-
 Bangladesh
-
 Belarus
-
 Belgium
-
 Bolivia
-
 Botswana
-
 Brazil
-
 Brunei
-
 Bulgaria
-
 Cambodia
-
 Cameroon
-
 Canada
-
 Chile
-
 China
-
 Colombia
-
 Congo
-
 Costa Rica
-
 Cote d'Ivoire
-
 Croatia
-
 Cuba
-
 Cyprus
-
 Czechia
-
 DR Congo
-
 Denmark
-
 Dominican Republic
-
 Ecuador
-
 Egypt
-
 El Salvador
-
 Estonia
-
 Eswatini
-
 Ethiopia
-
 Finland
-
 France
-
 Georgia
-
 Germany
-
 Ghana
-
 Greece
-
 Haiti
-
 Hong Kong
-
 Hungary
-
 India
-
 Indonesia
-
 Iran, Islamic republic
-
 Iraq
-
 Ireland
-
 Israel
-
 Italy
-
 Jamaica
-
 Japan
-
 Jordan
-
 Kazakhstan
-
 Kenya
-
 Korea
-
 Kuwait
-
 Kyrgyzstan
-
 Laos
-
 Latvia
-
 Lebanon
-
 Lesotho
-
 Libya
-
 Lithuania
-
 Luxembourg
-
 Madagascar
-
 Malaysia
-
 Malta
-
 Mauritius
-
 Mexico
-
 Moldova
-
 Mongolia
-
 Montenegro
-
 Morocco
-
 Mozambique
-
 Myanmar
-
 Namibia
-
 Nepal
-
 Netherlands
-
 New Zealand
-
 Nigeria
-
 North Macedonia
-
 Norway
-
 Oman
-
 Pakistan
-
 Palestine
-
 Panama
-
 Papua New Guinea
-
 Paraguay
-
 Peru
-
 Philippines
-
 Poland
-
 Portugal
-
 Puerto Rico
-
 Qatar
-
 Reunion
-
 Romania
-
 Rwanda
-
 Saudi Arabia
-
 Serbia
-
 Singapore
-
 Slovakia
-
 Slovenia
-
 Somalia
-
 South Africa
-
 Spain
-
 Sri Lanka
-
 Sweden
-
 Switzerland
-
 Syria
-
 Taiwan
-
 Tajikistan
-
 Tanzania
-
 Thailand
-
 Trinidad and Tobago
-
 Tunisia
-
 Turkey
-
 UAE
-
 Uganda
-
 Ukraine
-
 United Kingdom
-
United States
-
 Uruguay
-
 Uzbekistan
-
 Venezuela
-
 Vietnam
-
 Yemen
-
 Zambia
-
 Zimbabwe
- Forex
- Crypto












