

Morgan Stanley stock faces support test: Technical outlook

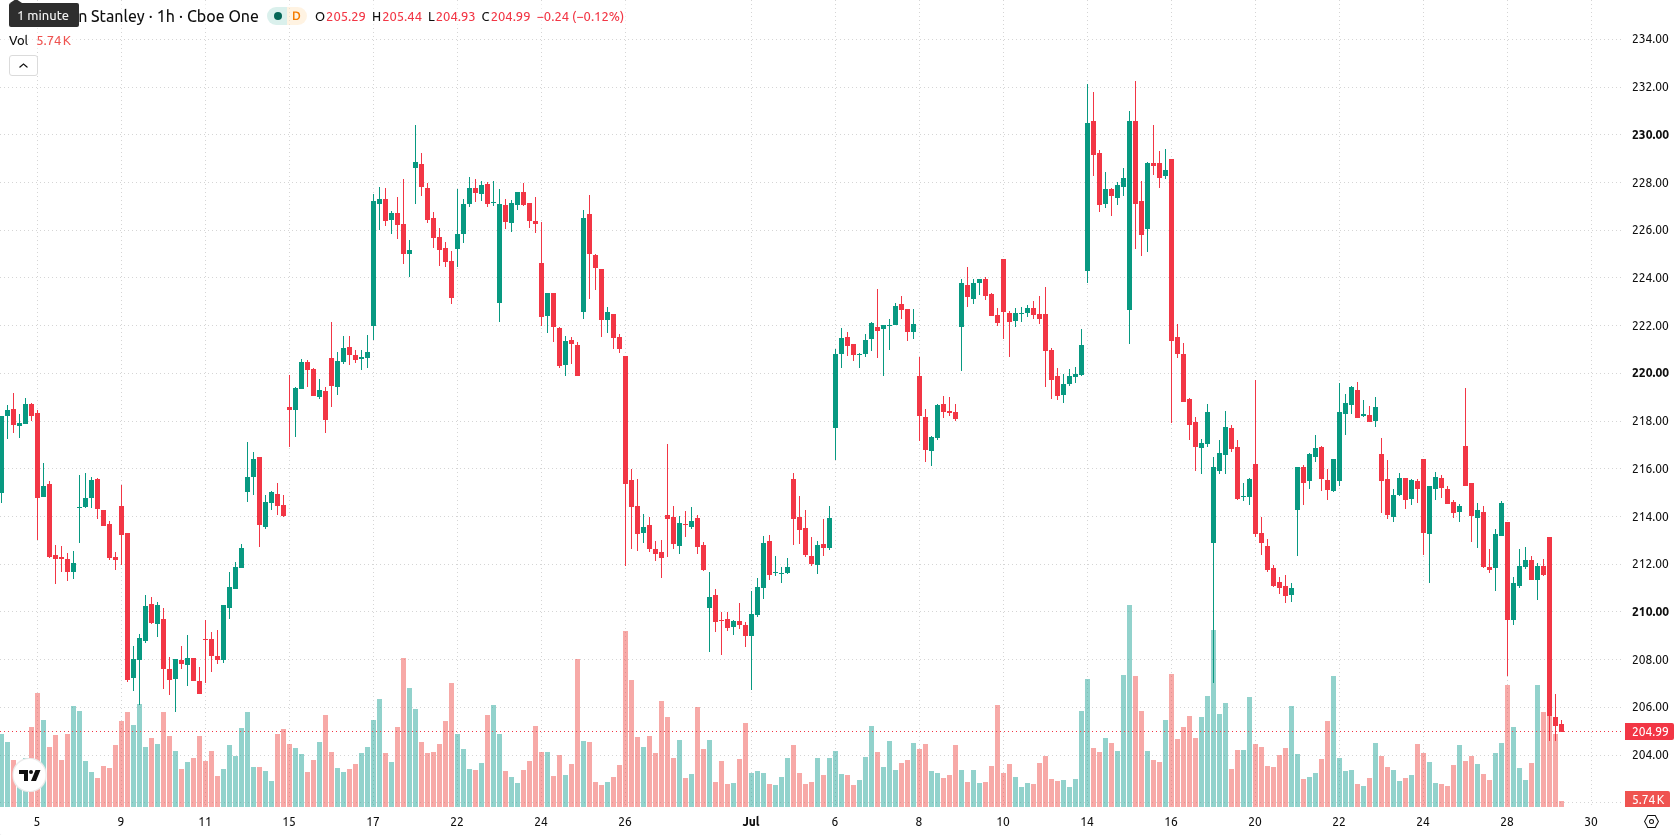
Morgan Stanley (MS) stock is trading at $204.27 after a daily decline of 3.46%. The price sits below its key short- and medium-term moving averages while remaining above its long-term average, reflecting near-term pressure but ongoing support at deeper levels.
 186.08
192.90
Highlights
- Morgan Stanley launched two new spot ETFs for Ethereum and Solana on NYSE Arca, featuring the lowest US expense ratio of 0.14%.
- These ETFs uniquely offer staking rewards, providing regulated access to digital asset yields and potential for recurring fees for the firm.
- Technical outlook is bearish, with price trading below key averages, strong downside momentum, and likely consolidation between $199.01 and $209.53.
ETF launches with staking rewards as digital asset push meets selling
Morgan Stanley has expanded its digital asset product line by launching two new spot exchange-traded funds on NYSE Arca, the Morgan Stanley Ethereum Trust (MSSE) and the Morgan Stanley Solana Trust (MSOL), both carrying a 0.14% expense ratio that is currently the lowest for these types of products in the US, according to Finance Yahoo. The inclusion of staking rewards distinguishes these ETFs by offering investors direct exposure to yield opportunities within the regulated fund structure. This move enables broader access to digital assets for the firm’s clients and may strengthen recurring fee streams — though price action has remained under broader selling pressure.
Oversold signals deepen as price battles key resistance and volatility
Technically, MS is trading below the MA-20 at $212.22 and the MA-50 at $214.07, while remaining above the MA-200, which stands at $183.6 and acts as a key support zone. The Ichimoku Kijun is at $211.97, marking immediate resistance. Momentum indicators remain decisively weak: with MACD in Sell mode, ADX neutral, and RSI at 29.01 together with Stoch RSI, CCI, and Bull/Bear Power all indicating strongly oversold or seller-dominated conditions. The Awesome Oscillator is also negative, and today’s session closed near the day’s low amid high volatility, confirming continued downside momentum.
Further downside risk persists amid volatility and narrow rebound window
For the coming sessions, a consolidation phase is expected within the $199.01 to $209.53 price band, reflecting typical volatility at current levels. The outlook skews strongly toward further decline, with limited prospects for a near-term rebound. Should the price break above $211.97, an upside attempt could materialize, but a fall below $199.01 may trigger fresh selling and accelerate losses.
Earlier, analysts noted that Morgan Stanley was exhibiting sustained long-term bullish momentum despite short-term consolidation risks. The recent technical deterioration, along with new strategic moves into digital assets, signals investors should watch for a decisive break below $199.01 as a trigger for further downside or a reversal above $211.97 to shift the immediate outlook.










-
 Afghanistan
-
 Albania
-
 Algeria
-
 Angola
-
 Argentina
-
 Armenia
-
 Australia
-
 Austria
-
 Azerbaijan
-
 Bahamas
-
 Bahrain
-
 Bangladesh
-
 Belarus
-
 Belgium
-
 Bolivia
-
 Botswana
-
 Brazil
-
 Brunei
-
 Bulgaria
-
 Cambodia
-
 Cameroon
-
 Canada
-
 Chile
-
 China
-
 Colombia
-
 Congo
-
 Costa Rica
-
 Cote d'Ivoire
-
 Croatia
-
 Cuba
-
 Cyprus
-
 Czechia
-
 DR Congo
-
 Denmark
-
 Dominican Republic
-
 Ecuador
-
 Egypt
-
 El Salvador
-
 Estonia
-
 Eswatini
-
 Ethiopia
-
 Finland
-
 France
-
 Georgia
-
 Germany
-
 Ghana
-
 Greece
-
 Haiti
-
 Hong Kong
-
 Hungary
-
 India
-
 Indonesia
-
 Iran, Islamic republic
-
 Iraq
-
 Ireland
-
 Israel
-
 Italy
-
 Jamaica
-
 Japan
-
 Jordan
-
 Kazakhstan
-
 Kenya
-
 Korea
-
 Kuwait
-
 Kyrgyzstan
-
 Laos
-
 Latvia
-
 Lebanon
-
 Lesotho
-
 Libya
-
 Lithuania
-
 Luxembourg
-
 Madagascar
-
 Malaysia
-
 Malta
-
 Mauritius
-
 Mexico
-
 Moldova
-
 Mongolia
-
 Montenegro
-
 Morocco
-
 Mozambique
-
 Myanmar
-
 Namibia
-
 Nepal
-
 Netherlands
-
 New Zealand
-
 Nigeria
-
 North Macedonia
-
 Norway
-
 Oman
-
 Pakistan
-
 Palestine
-
 Panama
-
 Papua New Guinea
-
 Paraguay
-
 Peru
-
 Philippines
-
 Poland
-
 Portugal
-
 Puerto Rico
-
 Qatar
-
 Reunion
-
 Romania
-
 Rwanda
-
 Saudi Arabia
-
 Serbia
-
 Singapore
-
 Slovakia
-
 Slovenia
-
 Somalia
-
 South Africa
-
 Spain
-
 Sri Lanka
-
 Sweden
-
 Switzerland
-
 Syria
-
 Taiwan
-
 Tajikistan
-
 Tanzania
-
 Thailand
-
 Trinidad and Tobago
-
 Tunisia
-
 Turkey
-
 UAE
-
 Uganda
-
 Ukraine
-
 United Kingdom
-
United States
-
 Uruguay
-
 Uzbekistan
-
 Venezuela
-
 Vietnam
-
 Yemen
-
 Zambia
-
 Zimbabwe
- Forex
- Crypto












