

SoFi stock trades near $13.41 support amid persistent selloff pressure

SoFi Technologies (SOFI) stock is trading at $15.51, down 7.24% for the day and remaining below its key moving averages. The stock continues to show weakness after gapping lower and is currently trading close to the upper end of its intraday range.
 16.97
17.63
Highlights
- SoFi Technologies posted record Q2 2026 results with adjusted net revenue climbing 40% year-over-year to $1.21 billion and net income reaching $157 million.
- Loan originations surged to $14.8 billion and total membership grew to 15.8 million, reflecting accelerating business momentum.
- Technicals point to continued bearish pressure below key averages, with a likely trading range of $13.41–$16.10 and only a 22% probability of near-term recovery.
Operational gains overshadowed by persistent stock selling pressure
SoFi Technologies reported record second quarter 2026 results, with adjusted net revenue up 40% year-over-year to $1.21 billion, $14.8 billion in loan originations, total membership reaching 15.8 million, and net income of $157 million, according to Businesswire. The latest quarterly performance demonstrates strong operational momentum, reflecting significant growth across both lending and member acquisition. These figures indicate an underlying improvement in the company’s fundamentals, though price action has remained under broader selling pressure.
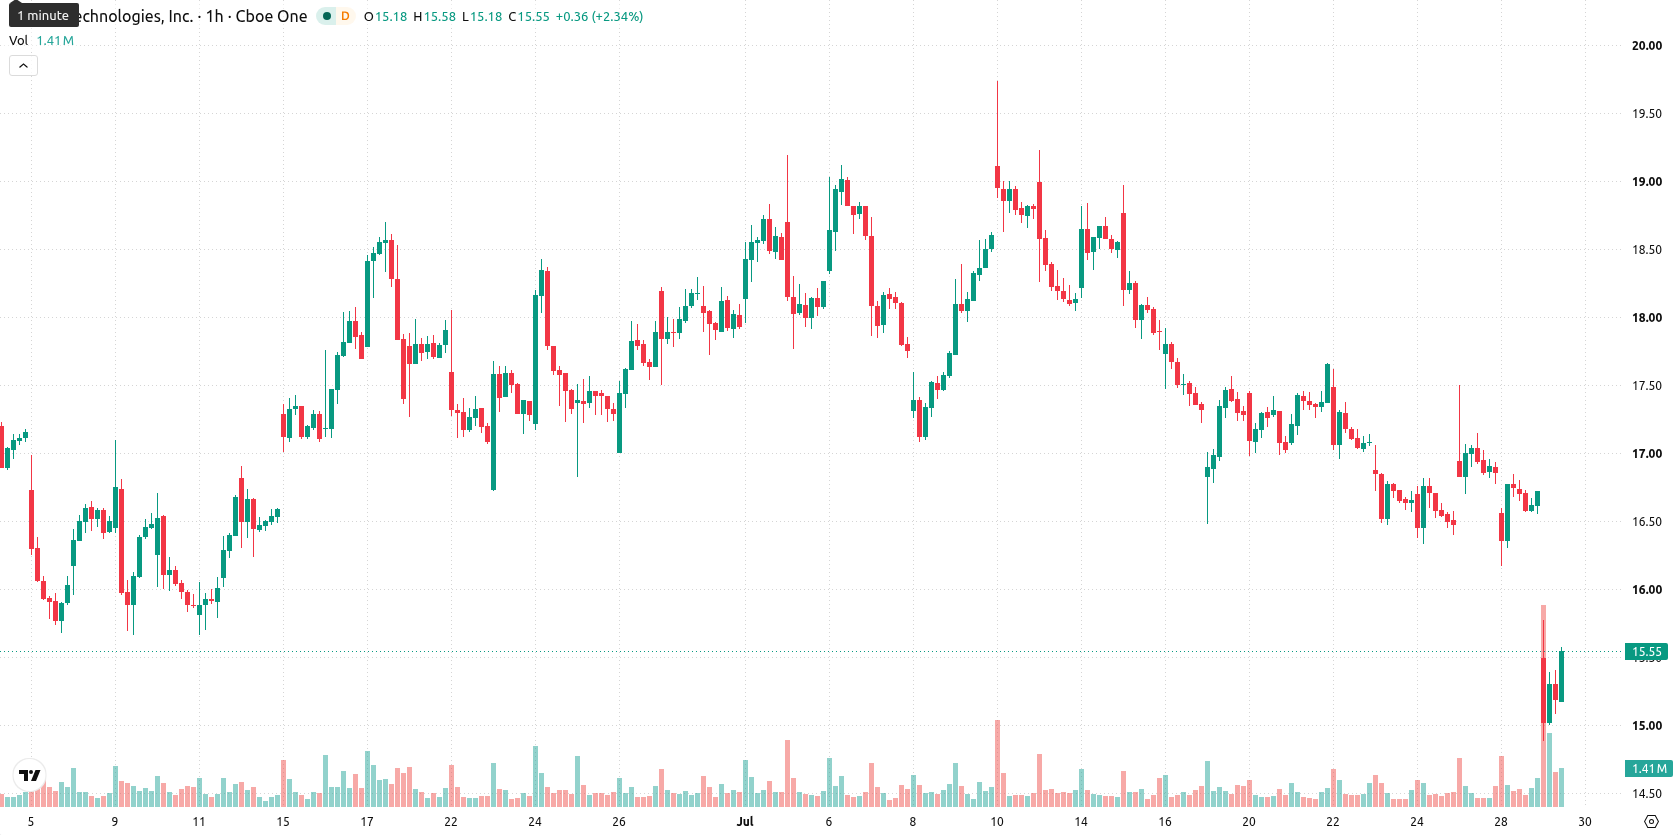
Sell momentum prevails as oversold readings signal potential rebound
On the hourly timeframe, SOFI is trading below both the MA-20 and MA-50, while on the daily timeframe, it remains under the MA-200. Immediate resistance is identified at the Ichimoku Kijun level of $16.19. Indicator signals are mostly negative, with MACD and ADX confirming a sell bias, and Awesome Oscillator also supporting downward momentum. RSI, CCI, and Bull/Bear Power indicate oversold conditions and persistent seller dominance, whereas Stochastic RSI shows a strong buy, revealing a divergence and signaling potential for a short-term rebound against the prevailing negative momentum.
Downside risk dominates as price consolidates near volatility support
Over the next two to three trading days, SOFI is projected to fluctuate within a volatility band of $13.41 to $16.1. There is a 78% probability of further decline, while the chance of a recovery is just 22%. The baseline scenario anticipates price consolidating within this range. If SOFI manages a sustained break above $16.19, a recovery may develop; conversely, a move below $13.41 would signal intensified selling and greater downside risk.
Earlier, analysts noted that SoFi shares were showing market indecision as investors weighed pre-earnings institutional accumulation against persistent technical weakness. The current post-earnings landscape reinforces this uncertainty, with recent operational gains overshadowed by deepening short-term downside risk, making $13.41 the crucial support level to monitor for any potential inflection.










-
 Afghanistan
-
 Albania
-
 Algeria
-
 Angola
-
 Argentina
-
 Armenia
-
 Australia
-
 Austria
-
 Azerbaijan
-
 Bahamas
-
 Bahrain
-
 Bangladesh
-
 Belarus
-
 Belgium
-
 Bolivia
-
 Botswana
-
 Brazil
-
 Brunei
-
 Bulgaria
-
 Cambodia
-
 Cameroon
-
 Canada
-
 Chile
-
 China
-
 Colombia
-
 Congo
-
 Costa Rica
-
 Cote d'Ivoire
-
 Croatia
-
 Cuba
-
 Cyprus
-
 Czechia
-
 DR Congo
-
 Denmark
-
 Dominican Republic
-
 Ecuador
-
 Egypt
-
 El Salvador
-
 Estonia
-
 Eswatini
-
 Ethiopia
-
 Finland
-
 France
-
 Georgia
-
 Germany
-
 Ghana
-
 Greece
-
 Haiti
-
 Hong Kong
-
 Hungary
-
 India
-
 Indonesia
-
 Iran, Islamic republic
-
 Iraq
-
 Ireland
-
 Israel
-
 Italy
-
 Jamaica
-
 Japan
-
 Jordan
-
 Kazakhstan
-
 Kenya
-
 Korea
-
 Kuwait
-
 Kyrgyzstan
-
 Laos
-
 Latvia
-
 Lebanon
-
 Lesotho
-
 Libya
-
 Lithuania
-
 Luxembourg
-
 Madagascar
-
 Malaysia
-
 Malta
-
 Mauritius
-
 Mexico
-
 Moldova
-
 Mongolia
-
 Montenegro
-
 Morocco
-
 Mozambique
-
 Myanmar
-
 Namibia
-
 Nepal
-
 Netherlands
-
 New Zealand
-
 Nigeria
-
 North Macedonia
-
 Norway
-
 Oman
-
 Pakistan
-
 Palestine
-
 Panama
-
 Papua New Guinea
-
 Paraguay
-
 Peru
-
 Philippines
-
 Poland
-
 Portugal
-
 Puerto Rico
-
 Qatar
-
 Reunion
-
 Romania
-
 Rwanda
-
 Saudi Arabia
-
 Serbia
-
 Singapore
-
 Slovakia
-
 Slovenia
-
 Somalia
-
 South Africa
-
 Spain
-
 Sri Lanka
-
 Sweden
-
 Switzerland
-
 Syria
-
 Taiwan
-
 Tajikistan
-
 Tanzania
-
 Thailand
-
 Trinidad and Tobago
-
 Tunisia
-
 Turkey
-
 UAE
-
 Uganda
-
 Ukraine
-
 United Kingdom
-
United States
-
 Uruguay
-
 Uzbekistan
-
 Venezuela
-
 Vietnam
-
 Yemen
-
 Zambia
-
 Zimbabwe
- Forex
- Crypto












