

JBLU extends selloff as heavy fuel costs pressure near-term profitability

JetBlue Airways (JBLU) stock is trading at $5.8, marking a sharp daily decline of 3.42%. The price stands below its previous session close and is currently positioned above its short-, medium-, and long-term moving averages.
 3.27
3.93
3.27
3.93
Highlights
- JetBlue's Q2 2026 revenue surged 14.5% year-over-year to $2.7 billion, but losses persisted from high fuel costs and negative margins.
- The airline is accelerating capacity growth in Fort Lauderdale and implementing a new fare structure to drive regional market share after Spirit Airlines' exit.
- Technical signals strongly favor a bullish move, with expected price action ranging between $5.16 and $6.44 over the next three days.
Market share gains and revenue growth offset by losses, outlook improvements
JetBlue Airways posted its second quarter 2026 results, revealing a 14.5% year-over-year increase in operating revenue to $2.7 billion, but recording a GAAP net loss of $247 million, as reported by Quiverquant. The carrier reinstated its full-year 2026 financial outlook on July 28 and projected profitability improvement for the second half, although persistent negative operating margins and heavy fuel costs continue to weigh on performance, according to 247wallst. Additional updates included a 10.9% growth in revenue per available seat mile during the quarter (Finance Yahoo), the rollout of a new fare structure ahead of BlueFirst first class (Aerospaceglobalnews), and a near-40% surge in Fort Lauderdale capacity following Spirit Airlines' bankruptcy, with higher regional RASM despite the expansion (Flightglobal). These developments reflect operational momentum and efforts to capture market share, though price action has remained under broader selling pressure.
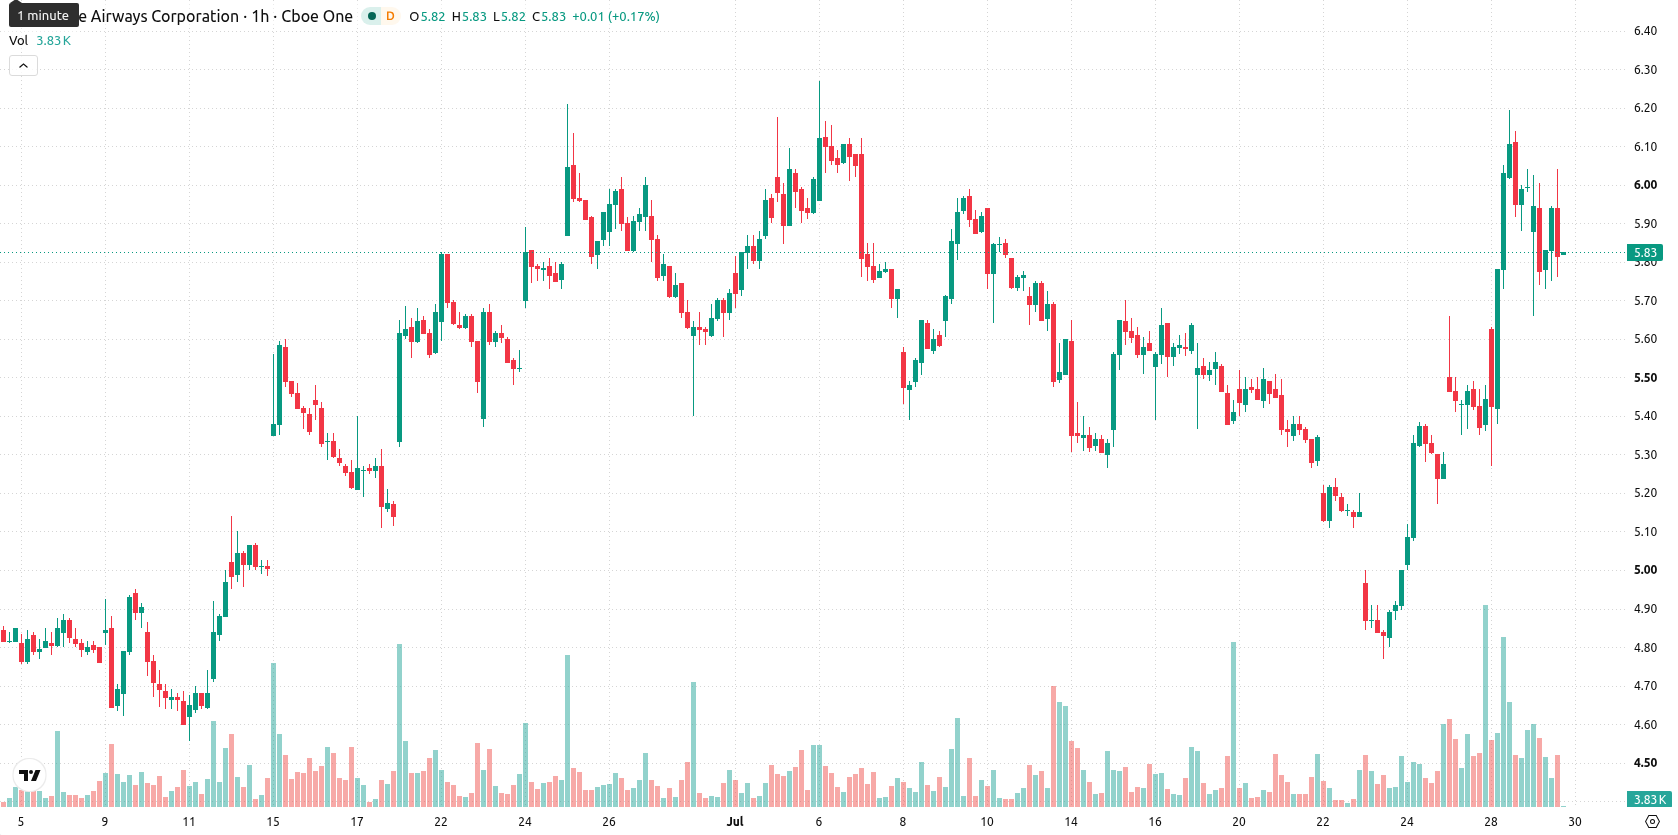
Mixed momentum signals amid bullish technical setup and defined range
On the technical front, JBLU is trading above its MA-20 at $5.7 and MA-50 at $5.4 on the hourly chart, and remains above the long-term MA-200 at $4.97 on the daily timeframe. Immediate support is located at the Ichimoku Kijun level of $5.6, with the upper resistance bound set near $6.44 and lower support at $5.16. Momentum indicators paint a mixed short-term picture: MACD signals a strong buy and ADX also flashes a buy, confirming strong upward momentum. RSI is at 62.99 (Buy), and CCI is also on Buy; Bull/Bear Power continues to favor buyers, all pointing to intraday bullish momentum. Stochastic RSI is Neutral, and the Awesome Oscillator is neutral as well, adding nuance to the momentum profile by indicating the absence of a reinforcing trend at this moment.
High upside potential with limited downside risk in near-term trading
Over the coming two to three trading days, JBLU is expected to fluctuate within a $5.16 to $6.44 range, reflecting typical volatility at current levels. The probability of an upward move remains very high, while downside risk is considered minimal for the near term. Baseline expectations point to sideways price action within this established range. If resistance is overcome, an extension toward higher levels may occur, but a decisive break below $5.16 support would expose JBLU to further losses.
Earlier, analysts noted that JetBlue Airways was exhibiting renewed bullish momentum amid strengthened fundamentals and growing optimism over operational initiatives. The current landscape reinforces this positive bias, with robust revenue trends and technical support underpinning an expectation of continued volatility within the established trading range.









-
 Afghanistan
-
 Albania
-
 Algeria
-
 Angola
-
 Argentina
-
 Armenia
-
 Australia
-
 Austria
-
 Azerbaijan
-
 Bahamas
-
 Bahrain
-
 Bangladesh
-
 Belarus
-
 Belgium
-
 Bolivia
-
 Botswana
-
 Brazil
-
 Brunei
-
 Bulgaria
-
 Cambodia
-
 Cameroon
-
 Canada
-
 Chile
Chile
-
 China
China
-
 Colombia
-
 Congo
Congo
-
 Costa Rica
-
 Cote d'Ivoire
-
 Croatia
-
 Cuba
Cuba
-
 Cyprus
-
 Czechia
-
 DR Congo
-
 Denmark
-
 Dominican Republic
-
 Ecuador
-
 Egypt
Egypt
-
 El Salvador
-
 Estonia
-
 Eswatini
-
 Ethiopia
-
 Finland
-
 France
-
 Georgia
-
 Germany
-
 Ghana
Ghana
-
 Greece
-
 Haiti
Haiti
-
 Hong Kong
-
 Hungary
-
 India
India
-
 Indonesia
-
 Iran, Islamic republic
-
 Iraq
Iraq
-
 Ireland
-
 Israel
-
 Italy
Italy
-
 Jamaica
-
 Japan
Japan
-
 Jordan
-
 Kazakhstan
-
 Kenya
Kenya
-
 Korea
Korea
-
 Kuwait
-
 Kyrgyzstan
-
 Laos
Laos
-
 Latvia
-
 Lebanon
-
 Lesotho
-
 Libya
Libya
-
 Lithuania
-
 Luxembourg
-
 Madagascar
-
 Malaysia
-
 Malta
Malta
-
 Mauritius
-
 Mexico
-
 Moldova
-
 Mongolia
-
 Montenegro
-
 Morocco
-
 Mozambique
-
 Myanmar
-
 Namibia
-
 Nepal
Nepal
-
 Netherlands
-
 New Zealand
-
 Nigeria
-
 North Macedonia
-
 Norway
-
 Oman
Oman
-
 Pakistan
-
 Palestine
-
 Panama
-
 Papua New Guinea
-
 Paraguay
-
 Peru
Peru
-
 Philippines
-
 Poland
-
 Portugal
-
 Puerto Rico
-
 Qatar
Qatar
-
 Reunion
-
 Romania
-
 Rwanda
-
 Saudi Arabia
-
 Serbia
-
 Singapore
-
 Slovakia
-
 Slovenia
-
 Somalia
-
 South Africa
-
 Spain
Spain
-
 Sri Lanka
-
 Sweden
-
 Switzerland
-
 Syria
Syria
-
 Taiwan
-
 Tajikistan
-
 Tanzania
-
 Thailand
-
 Trinidad and Tobago
-
 Tunisia
-
 Turkey
-
 UAE
UAE
-
 Uganda
-
 Ukraine
-
 United Kingdom
-
United States
-
 Uruguay
-
 Uzbekistan
-
 Venezuela
-
 Vietnam
-
 Yemen
Yemen
-
 Zambia
-
 Zimbabwe
- Forex
- Crypto












