


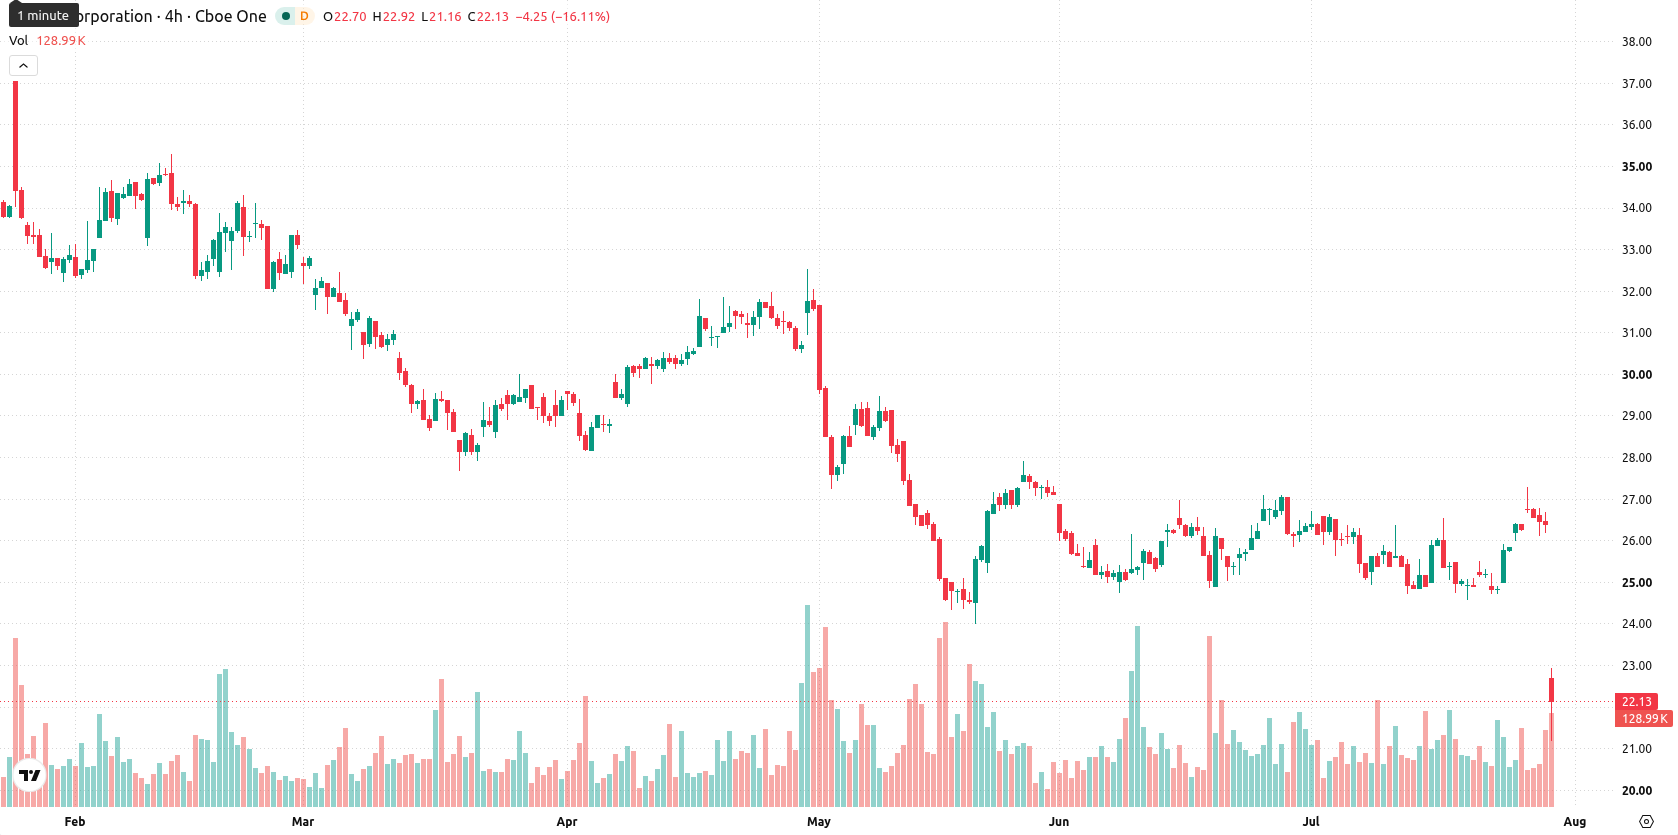
LKQ Corporation (LKQ) fell 16.88% after posting second quarter 2026 results that missed Wall Street expectations on both revenue and earnings. The move is supported by the stock trading below all major moving averages, with downside pressure reinforced by a bearish technical structure.
 19.98
19.98
Highlights
- LKQ reported Q2 2026 revenue of $3.41 billion, down 3% year-on-year, missing analyst forecasts and revising full-year 2026 guidance downward.
- The board continued its strategic review, including possible divestitures or a sale, and maintained the quarterly dividend at $0.30 per share.
- LKQ shares trade below key moving averages with high volatility, bearish momentum, and a near-term price range projected between $20.78 and $26.57.
Guidance cut and strategic review deepen shareholder uncertainty
LKQ Corporation reported second quarter 2026 financial results with revenue of $3.41 billion, reflecting a 3% decrease from the previous year, and net income attributable to stockholders of $136 million with diluted earnings per share of $0.52. The company missed forecasts on both revenue and earnings for the period and revised its full-year 2026 financial outlook downward, lowering guidance for EPS, organic growth, and free cash flow. The board declared a $0.30 quarterly dividend payable on September 3, 2026, and continued a strategic review process, including potential divestitures or a company sale. In the first half of 2026, $207 million was returned to shareholders through share repurchases and dividends.
Diverging technical signals amid entrenched selling and overbought readings
LKQ is trading below all major moving averages, with the current price at $21.94 sitting under the 20-day ($25.62), 50-day ($25.87), and 200-day ($29.54) levels. This pattern indicates ongoing pressure from sellers in the short and medium term, with bearish long-term alignment also signaled. The near-term ceiling is $22.84 and the near-term floor is $21.24. Momentum readings are mixed for LKQ. The Moving Average Convergence Divergence (MACD) and Average Directional Index (ADX) both suggest neutral momentum, but the Relative Strength Index (RSI) is at 55.42 and signals a buy, even as Stochastic RSI, Commodity Channel Index (CCI), and Bull/Bear Power (BBP) all read overbought. BBP shows buyers currently dominate intraday momentum. The Awesome Oscillator (AO) signals strong buy. Following a sharp downside gap of about $3.55 or 13.45% from the previous close, the stock is down by $4.455 to $21.94, a drop of 16.88%. Price action is mid-range between $21.24 and $22.84, with daily volatility amplitude at 7.53% and trading reflecting pressure after the open. There is a notable divergence between overbought stochastic signals and the pronounced downward price move.
Earlier, analysts noted that LKQ was facing persistent downside pressure, with only a mild rebound within an overall bearish trend. The current breakdown after disappointing earnings strengthens the bearish case, making a sustained move below $21.24 a key downside risk for traders to watch in the coming sessions.






Latest LKQ Corporation News




-
 Afghanistan
-
 Albania
-
 Algeria
-
 Angola
-
 Argentina
-
 Armenia
-
 Australia
-
 Austria
-
 Azerbaijan
-
 Bahamas
-
 Bahrain
-
 Bangladesh
-
 Belarus
-
 Belgium
-
 Bolivia
-
 Botswana
-
 Brazil
-
 Brunei
-
 Bulgaria
-
 Cambodia
-
 Cameroon
-
 Canada
-
 Chile
-
 China
-
 Colombia
-
 Congo
-
 Costa Rica
-
 Cote d'Ivoire
-
 Croatia
-
 Cuba
-
 Cyprus
-
 Czechia
-
 DR Congo
-
 Denmark
-
 Dominican Republic
-
 Ecuador
-
 Egypt
-
 El Salvador
-
 Estonia
-
 Eswatini
-
 Ethiopia
-
 Finland
-
 France
-
 Georgia
-
 Germany
-
 Ghana
-
 Greece
-
 Haiti
-
 Hong Kong
-
 Hungary
-
 India
-
 Indonesia
-
 Iran, Islamic republic
-
 Iraq
-
 Ireland
-
 Israel
-
 Italy
-
 Jamaica
-
 Japan
-
 Jordan
-
 Kazakhstan
-
 Kenya
-
 Korea
-
 Kuwait
-
 Kyrgyzstan
-
 Laos
-
 Latvia
-
 Lebanon
-
 Lesotho
-
 Libya
-
 Lithuania
-
 Luxembourg
-
 Madagascar
-
 Malaysia
-
 Malta
-
 Mauritius
-
 Mexico
-
 Moldova
-
 Mongolia
-
 Montenegro
-
 Morocco
-
 Mozambique
-
 Myanmar
-
 Namibia
-
 Nepal
-
 Netherlands
-
 New Zealand
-
 Nigeria
-
 North Macedonia
-
 Norway
-
 Oman
-
 Pakistan
-
 Palestine
-
 Panama
-
 Papua New Guinea
-
 Paraguay
-
 Peru
-
 Philippines
-
 Poland
-
 Portugal
-
 Puerto Rico
-
 Qatar
-
 Reunion
-
 Romania
-
 Rwanda
-
 Saudi Arabia
-
 Serbia
-
 Singapore
-
 Slovakia
-
 Slovenia
-
 Somalia
-
 South Africa
-
 Spain
-
 Sri Lanka
-
 Sweden
-
 Switzerland
-
 Syria
-
 Taiwan
-
 Tajikistan
-
 Tanzania
-
 Thailand
-
 Trinidad and Tobago
-
 Tunisia
-
 Turkey
-
 UAE
-
 Uganda
-
 Ukraine
-
 United Kingdom
-
United States
-
 Uruguay
-
 Uzbekistan
-
 Venezuela
-
 Vietnam
-
 Yemen
-
 Zambia
-
 Zimbabwe
- Forex
- Crypto












