

SoFi stock resistance test: Breakout levels to watch

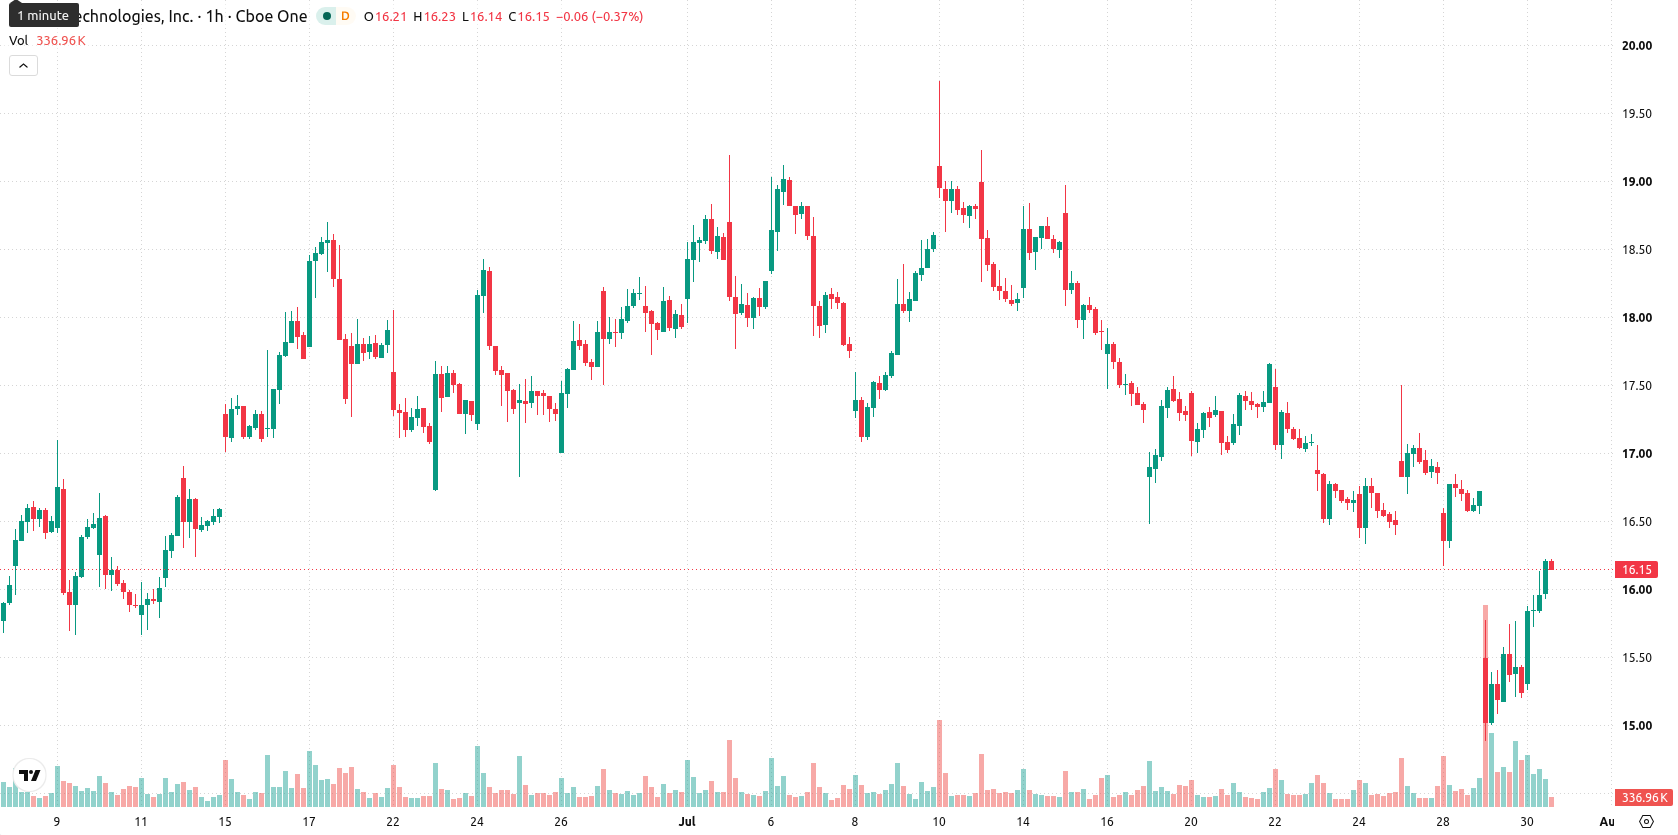
SoFi (SOFI) stock is trading at $16.13, up 5.74% on the day and closing near its session highs. The stock finished above its key short-term averages while remaining capped below medium- and long-term averages.
 15.11
16.68
Highlights
- SoFi Technologies posted a 40% year-over-year increase in adjusted net revenue to $1.21 billion, exceeding analyst estimates.
- The firm set new records in both loan originations at $14.8 billion and membership growth, raising full-year revenue guidance to $4.75–$4.85 billion.
- Technicals indicate short-term bullish momentum but persistent medium- and long-term downside risks, with expected price consolidation between $14.96 and $17.3 over the coming days.
Record revenue and raised guidance fuel bullish sentiment
SoFi Technologies delivered robust second-quarter 2026 results, reporting a 40% year-over-year surge in adjusted net revenue to a record $1.21 billion, alongside adjusted earnings per share of $0.12—surpassing analyst expectations. The company also set new records in loan originations at $14.8 billion and saw membership rise by 35% to 15.8 million, according to Benzinga, Gurufocus, and Investing.com. Management's decision to raise full-year 2026 adjusted revenue guidance to $4.75 billion to $4.85 billion, while maintaining EBITDA and EPS outlooks, underscores continued operational momentum and reinforces positive sentiment.
Short-term bullish action contrasts with longer-term technical caution
SOFI currently trades above its MA-20, yet remains beneath both the MA-50 and MA-200 levels, with the Ichimoku Kijun providing immediate support at $16.02. Technical indicators present a mixed backdrop: MACD signals strong selling pressure, ADX reflects a continued sell bias, while RSI hovers near neutral but hints at a buy reading. Stochastic RSI registers as overbought, CCI is neutral, and Bull/Bear Power reveals intraday momentum in favor of buyers. This configuration highlights a divergence between bullish short-term action and caution from trend-based signals.
Downside risk persists as range trading dominates near term
In the short term, SOFI is likely to consolidate within a range of $14.96 to $17.3 over the next two to three trading days. The probability of an upward breakout is assessed at 40%, with a downside move remaining more likely. The main scenario envisions continued back-and-forth action between immediate support and resistance, but a sustained push from buyers could clear $17.3. Conversely, a break below $14.96 would expose the stock to further weakness.
Earlier, analysts noted that despite strong operational results, SoFi stock faced persistent selling pressure and heightened downside risk. The current setup reveals a tug-of-war between bullish short-term momentum and cautious trend signals, with the next decisive move likely hinging on whether the stock can sustain a breakout above $17.3 or hold firm at $14.96 support.











-
 Afghanistan
-
 Albania
-
 Algeria
-
 Angola
-
 Argentina
-
 Armenia
-
 Australia
-
 Austria
-
 Azerbaijan
-
 Bahamas
-
 Bahrain
-
 Bangladesh
-
 Belarus
-
 Belgium
-
 Bolivia
-
 Botswana
-
 Brazil
-
 Brunei
-
 Bulgaria
-
 Cambodia
-
 Cameroon
-
 Canada
-
 Chile
-
 China
-
 Colombia
-
 Congo
-
 Costa Rica
-
 Cote d'Ivoire
-
 Croatia
-
 Cuba
-
 Cyprus
-
 Czechia
-
 DR Congo
-
 Denmark
-
 Dominican Republic
-
 Ecuador
-
 Egypt
-
 El Salvador
-
 Estonia
-
 Eswatini
-
 Ethiopia
-
 Finland
-
 France
-
 Georgia
-
 Germany
-
 Ghana
-
 Greece
-
 Haiti
-
 Hong Kong
-
 Hungary
-
 India
-
 Indonesia
-
 Iran, Islamic republic
-
 Iraq
-
 Ireland
-
 Israel
-
 Italy
-
 Jamaica
-
 Japan
-
 Jordan
-
 Kazakhstan
-
 Kenya
-
 Korea
-
 Kuwait
-
 Kyrgyzstan
-
 Laos
-
 Latvia
-
 Lebanon
-
 Lesotho
-
 Libya
-
 Lithuania
-
 Luxembourg
-
 Madagascar
-
 Malaysia
-
 Malta
-
 Mauritius
-
 Mexico
-
 Moldova
-
 Mongolia
-
 Montenegro
-
 Morocco
-
 Mozambique
-
 Myanmar
-
 Namibia
-
 Nepal
-
 Netherlands
-
 New Zealand
-
 Nigeria
-
 North Macedonia
-
 Norway
-
 Oman
-
 Pakistan
-
 Palestine
-
 Panama
-
 Papua New Guinea
-
 Paraguay
-
 Peru
-
 Philippines
-
 Poland
-
 Portugal
-
 Puerto Rico
-
 Qatar
-
 Reunion
-
 Romania
-
 Rwanda
-
 Saudi Arabia
-
 Serbia
-
 Singapore
-
 Slovakia
-
 Slovenia
-
 Somalia
-
 South Africa
-
 Spain
-
 Sri Lanka
-
 Sweden
-
 Switzerland
-
 Syria
-
 Taiwan
-
 Tajikistan
-
 Tanzania
-
 Thailand
-
 Trinidad and Tobago
-
 Tunisia
-
 Turkey
-
 UAE
-
 Uganda
-
 Ukraine
-
 United Kingdom
-
United States
-
 Uruguay
-
 Uzbekistan
-
 Venezuela
-
 Vietnam
-
 Yemen
-
 Zambia
-
 Zimbabwe
- Forex
- Crypto












