

What's behind Denison Mines Corp's latest 5.1% stock pullback?

Denison Mines Corp (DNN) slumped 5.14% after opening with a short-lived upside gap, as persistent selling pressure weighed on price action. The slide is supported by DNN trading below its 20-day, 50-day, and 200-day moving averages, highlighting a bearish tone across all trend horizons.
 2.22
2.28
Highlights
- Denison Mines advanced its Phoenix project, but no new corporate events or earnings updates were recorded in the period.
- Shares remain under broad selling pressure amid a lack of fresh fundamental catalysts for Denison Mines Corp.
- The stock trades below key moving averages with negative momentum and is expected to fluctuate between $2.54 and $3 over the next week.
Development progress highlighted as event calendar remains clear
Denison Mines advanced the development of its Phoenix project. No additional confirmed corporate events, earnings reports, or regulatory actions were recorded for Denison Mines Corp in the available period, though price action has remained under broader selling pressure.
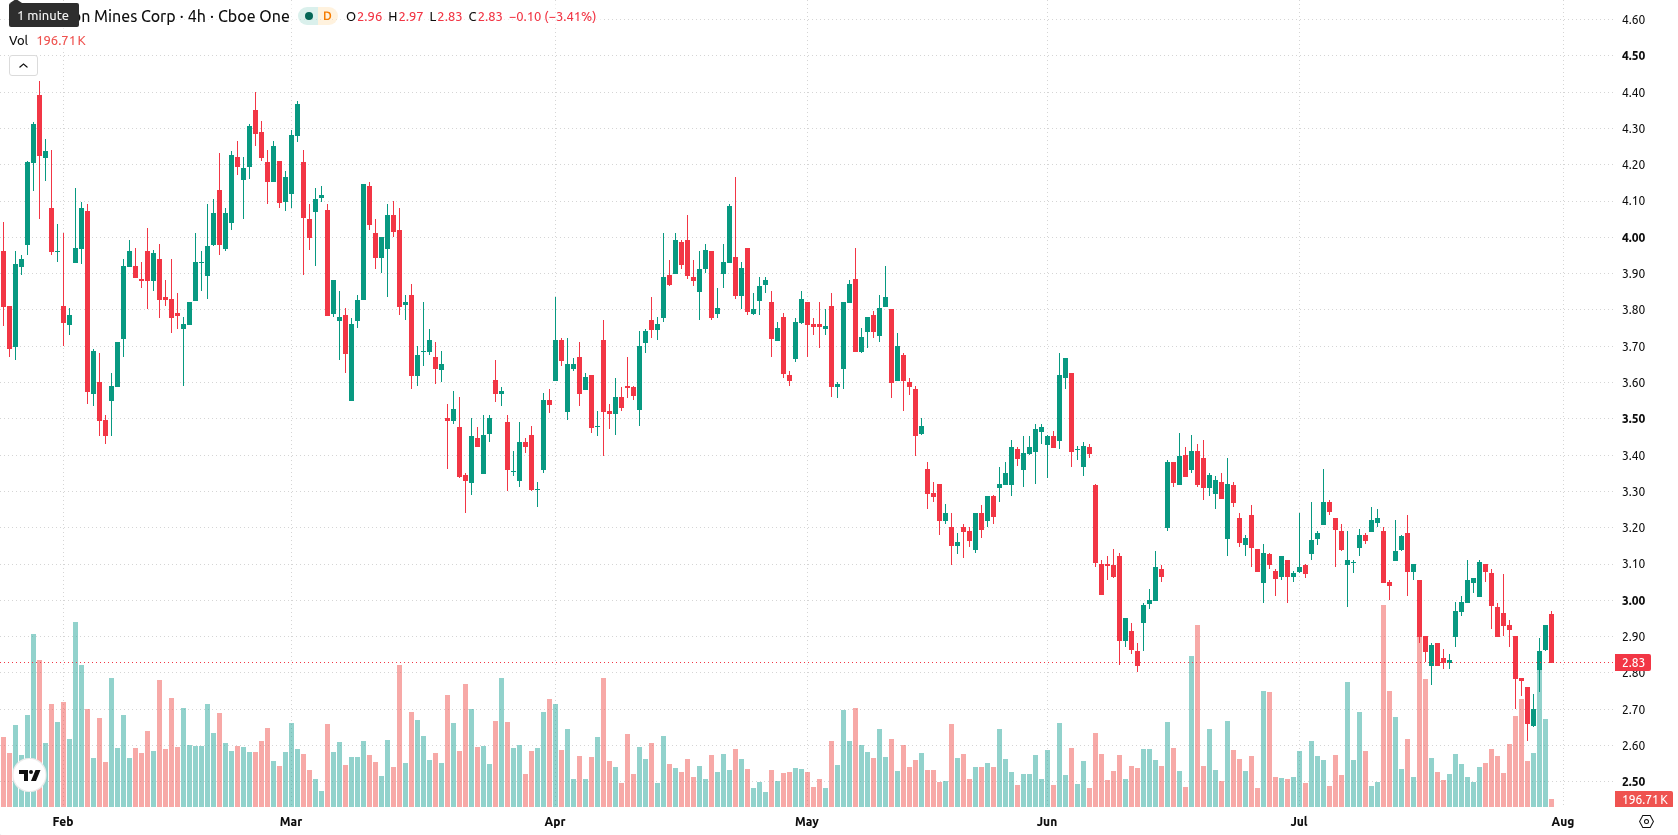
Technical weakness persists as indicators reveal mixed momentum
Denison Mines is trading beneath its 20-day, 50-day, and 200-day moving averages at $3.01, $3.14, and $3.3, indicating consistent downside pressure over short-, medium-, and long-term periods. The Ichimoku Kijun sits at $2.99, providing added resistance, while the nearest ceiling is $2.87 and support is at $2.61. Momentum signals are predominantly negative, with the MACD in 'Sell' territory and the ADX reflecting a weak trend at 16. The RSI is moderately weak at 46.1, also forecasting 'Sell', and the CCI at -73.19 confirms mild downward pressure. However, the Stochastic RSI is high at 76.71, indicating a 'Strong Buy'. Bull/Bear Power at 0 shows buyers are currently matching sellers, though the overall intraday bias remains pressured after the open. Oscillators and momentum indicators diverge, suggesting short-term directional instability.
Earlier, analysts noted that Denison Mines was showing improved technical momentum amid progress on its key Phoenix project, hinting at a potential shift toward a more constructive outlook. The current deterioration in price action and momentum now signals downside risk dominating the near term, making close attention to any break below the $2.61 support level critical for assessing renewed bearish pressure.






Latest Denison Mines News




-
 Afghanistan
-
 Albania
-
 Algeria
-
 Angola
-
 Argentina
-
 Armenia
-
 Australia
-
 Austria
-
 Azerbaijan
-
 Bahamas
-
 Bahrain
-
 Bangladesh
-
 Belarus
-
 Belgium
-
 Bolivia
-
 Botswana
-
 Brazil
-
 Brunei
-
 Bulgaria
-
 Cambodia
-
 Cameroon
-
 Canada
-
 Chile
-
 China
-
 Colombia
-
 Congo
-
 Costa Rica
-
 Cote d'Ivoire
-
 Croatia
-
 Cuba
-
 Cyprus
-
 Czechia
-
 DR Congo
-
 Denmark
-
 Dominican Republic
-
 Ecuador
-
 Egypt
-
 El Salvador
-
 Estonia
-
 Eswatini
-
 Ethiopia
-
 Finland
-
 France
-
 Georgia
-
 Germany
-
 Ghana
-
 Greece
-
 Haiti
-
 Hong Kong
-
 Hungary
-
 India
-
 Indonesia
-
 Iran, Islamic republic
-
 Iraq
-
 Ireland
-
 Israel
-
 Italy
-
 Jamaica
-
 Japan
-
 Jordan
-
 Kazakhstan
-
 Kenya
-
 Korea
-
 Kuwait
-
 Kyrgyzstan
-
 Laos
-
 Latvia
-
 Lebanon
-
 Lesotho
-
 Libya
-
 Lithuania
-
 Luxembourg
-
 Madagascar
-
 Malaysia
-
 Malta
-
 Mauritius
-
 Mexico
-
 Moldova
-
 Mongolia
-
 Montenegro
-
 Morocco
-
 Mozambique
-
 Myanmar
-
 Namibia
-
 Nepal
-
 Netherlands
-
 New Zealand
-
 Nigeria
-
 North Macedonia
-
 Norway
-
 Oman
-
 Pakistan
-
 Palestine
-
 Panama
-
 Papua New Guinea
-
 Paraguay
-
 Peru
-
 Philippines
-
 Poland
-
 Portugal
-
 Puerto Rico
-
 Qatar
-
 Reunion
-
 Romania
-
 Rwanda
-
 Saudi Arabia
-
 Serbia
-
 Singapore
-
 Slovakia
-
 Slovenia
-
 Somalia
-
 South Africa
-
 Spain
-
 Sri Lanka
-
 Sweden
-
 Switzerland
-
 Syria
-
 Taiwan
-
 Tajikistan
-
 Tanzania
-
 Thailand
-
 Trinidad and Tobago
-
 Tunisia
-
 Turkey
-
 UAE
-
 Uganda
-
 Ukraine
-
 United Kingdom
-
United States
-
 Uruguay
-
 Uzbekistan
-
 Venezuela
-
 Vietnam
-
 Yemen
-
 Zambia
-
 Zimbabwe
- Forex
- Crypto












