

Tradeweb stock rises over 3% as Q2 earnings beat boosts buying interest

Tradeweb Markets Inc. (TW) surged 3.28% as strong Q2 results and a significantly increased dividend drove renewed buying interest. The rebound gains traction in the short term, supported by the stock holding above its 20-day and 50-day moving averages, though a longer-term bearish structure still limits further upside.
 124.74
125.11
Highlights
- Tradeweb delivered strong Q2 results, with revenue up 9% year-over-year to $558.9 million and net income reaching $181.3 million.
- The company boosted capital returns by raising its quarterly dividend 16.7%, executing $300 million in share buybacks, and highlighting tech investments and international growth.
- Tradeweb trades near session highs with technicals signaling consolidation around $101.01, but indicator mix suggests a high likelihood of downward movement toward the $93.78–$108.25 range.
Record revenues and tech investment drive positive sentiment shift
Tradeweb reported a 9% year-over-year rise in revenue to $558.9 million and net income of $181.3 million for the second quarter of 2026, setting a record in average daily trading volumes at $3.0 trillion. The company also completed $300 million in share repurchases and raised its quarterly dividend by 16.7% to $0.14 per share. Ongoing investments in automation and AI technologies, along with accelerated international revenue and a partnership with Kalshi to integrate prediction market data, were also highlighted.
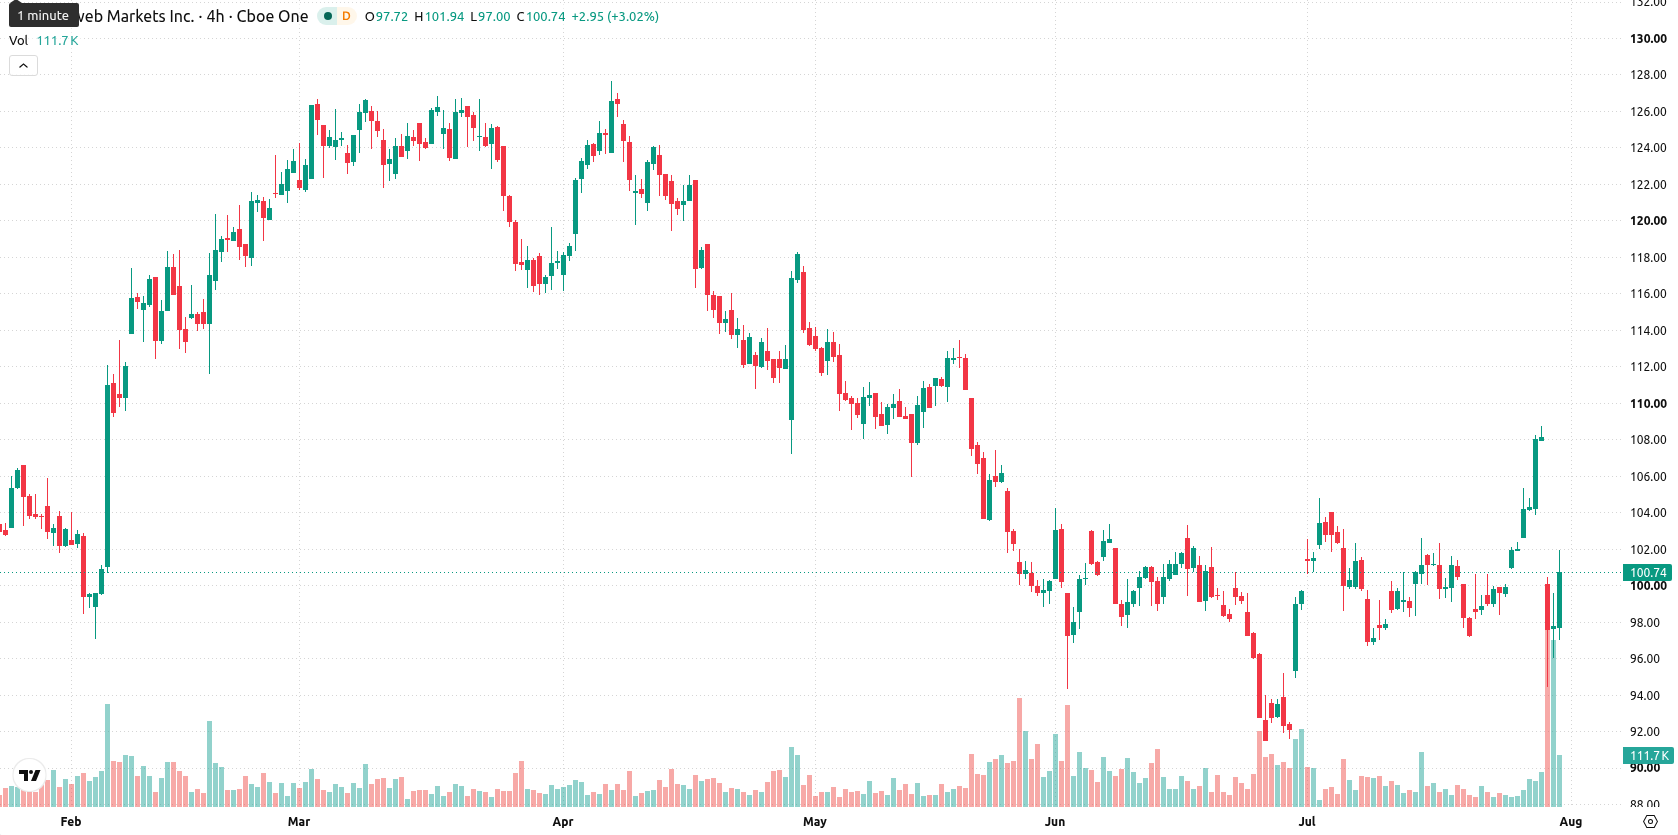
Near-term support persists as mixed momentum signals linger
Tradeweb is trading above both its 20-day and 50-day moving averages ($100.46 and $100.37), but remains below the long-term 200-day moving average ($109.16). This positions the stock with short- and medium-term support, though the broader trend remains bearish. Immediate technical levels to monitor include a near-term resistance at $101.91 and support at $100.46. Momentum indicators are mixed: the MACD signal is positive and suggests ongoing upward momentum, yet the Average Directional Index (ADX) at 15.7 indicates trend neutrality. The Relative Strength Index (RSI) of 45.39 reflects persistent sell pressure, and oversold signals from the Stochastic RSI (6.61), Commodity Channel Index (CCI) at -123.08, and Bull/Bear Power (BBP) at -0.27 suggest sellers still dominate intraday action. The stock sits near session highs after gaining $3.21 for the day amid 4.60% intraday volatility, reflecting intraday strength even as oscillators indicate oversold dynamics and mixed momentum signals.
Earlier, analysts noted that Tradeweb’s short- and medium-term momentum was supported by positive revenue trends and institutional demand, while longer-term technical caution persisted. The renewed strength following robust Q2 earnings and a higher dividend adds conviction to this outlook, but with technical signals still mixed and downside risk prevailing, investors should closely monitor the $100.46 support as confirmation of the current consolidation scenario.






Latest Tradeweb Markets News




-
 Afghanistan
-
 Albania
-
 Algeria
-
 Angola
-
 Argentina
-
 Armenia
-
 Australia
-
 Austria
-
 Azerbaijan
-
 Bahamas
-
 Bahrain
-
 Bangladesh
-
 Belarus
-
 Belgium
-
 Bolivia
-
 Botswana
-
 Brazil
-
 Brunei
-
 Bulgaria
-
 Cambodia
-
 Cameroon
-
 Canada
-
 Chile
-
 China
-
 Colombia
-
 Congo
-
 Costa Rica
-
 Cote d'Ivoire
-
 Croatia
-
 Cuba
-
 Cyprus
-
 Czechia
-
 DR Congo
-
 Denmark
-
 Dominican Republic
-
 Ecuador
-
 Egypt
-
 El Salvador
-
 Estonia
-
 Eswatini
-
 Ethiopia
-
 Finland
-
 France
-
 Georgia
-
 Germany
-
 Ghana
-
 Greece
-
 Haiti
-
 Hong Kong
-
 Hungary
-
 India
-
 Indonesia
-
 Iran, Islamic republic
-
 Iraq
-
 Ireland
-
 Israel
-
 Italy
-
 Jamaica
-
 Japan
-
 Jordan
-
 Kazakhstan
-
 Kenya
-
 Korea
-
 Kuwait
-
 Kyrgyzstan
-
 Laos
-
 Latvia
-
 Lebanon
-
 Lesotho
-
 Libya
-
 Lithuania
-
 Luxembourg
-
 Madagascar
-
 Malaysia
-
 Malta
-
 Mauritius
-
 Mexico
-
 Moldova
-
 Mongolia
-
 Montenegro
-
 Morocco
-
 Mozambique
-
 Myanmar
-
 Namibia
-
 Nepal
-
 Netherlands
-
 New Zealand
-
 Nigeria
-
 North Macedonia
-
 Norway
-
 Oman
-
 Pakistan
-
 Palestine
-
 Panama
-
 Papua New Guinea
-
 Paraguay
-
 Peru
-
 Philippines
-
 Poland
-
 Portugal
-
 Puerto Rico
-
 Qatar
-
 Reunion
-
 Romania
-
 Rwanda
-
 Saudi Arabia
-
 Serbia
-
 Singapore
-
 Slovakia
-
 Slovenia
-
 Somalia
-
 South Africa
-
 Spain
-
 Sri Lanka
-
 Sweden
-
 Switzerland
-
 Syria
-
 Taiwan
-
 Tajikistan
-
 Tanzania
-
 Thailand
-
 Trinidad and Tobago
-
 Tunisia
-
 Turkey
-
 UAE
-
 Uganda
-
 Ukraine
-
 United Kingdom
-
United States
-
 Uruguay
-
 Uzbekistan
-
 Venezuela
-
 Vietnam
-
 Yemen
-
 Zambia
-
 Zimbabwe
- Forex
- Crypto












