

Tradeweb shares drop almost 3% after bearish technical structure weighs on price

Tradeweb Markets Inc. (TW) fell 2.92% on the day as downside momentum and weak trend strength drove selling pressure across the session. The decline is supported by a bearish technical structure, with the stock trading below its 20- and 200-day moving averages, heightening the risk of further losses.
 125.11
Highlights
- Tradeweb stock is trading below key short- and long-term averages, confirming a bearish structure with short-term downside pressure.
- Momentum signals are mixed, with MACD indicating positive momentum but trend strength remaining weak and overbought readings suggesting limited upside.
- Expected trading range for the next 5 days is $101.36 to $105.7, with resistance at $104.28 and support at $102.
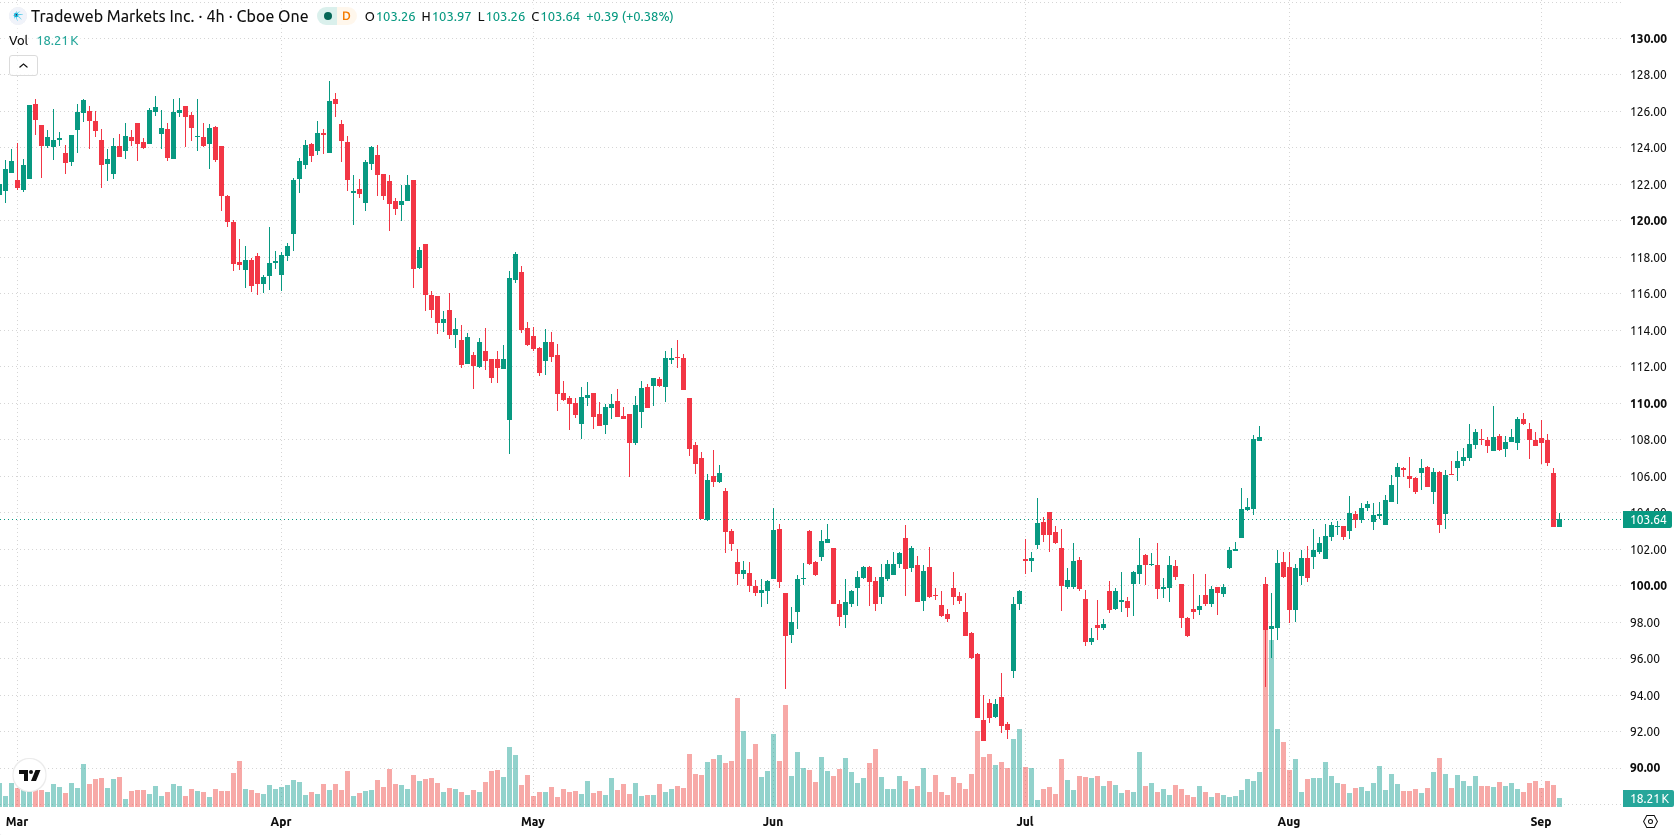
Mixed momentum signals amid breach of technical support and dominant sellers
Tradeweb is trading below its 20-day moving average ($105.71) and the 200-day moving average ($108.84), but still above the 50-day moving average ($101.98). This suggests short-term downside pressure within a broadly bearish medium- to long-term structure, with support at $102 (Ichimoku Kijun) and nearby resistance at $104.28. Momentum signals are mixed: the MACD gives a Strong Buy reading, indicating underlying positive momentum, yet the Average Directional Index (ADX) remains Neutral, reflecting weak trend strength. The Relative Strength Index (RSI) at 54.77 and Commodity Channel Index (CCI) at 65.58 both signal mild buy conditions, though Bull/Bear Power (BBP) at 2.22 shows that buyers currently dominate and the overbought reading suggests caution for further upside. The Stochastic RSI and Awesome Oscillator are Neutral. The stock is down $3.12 or 2.92% on the day following an upside gap of $0.43 (0.4%), and is trading near the session low. Intraday volatility stands at 2.74%. Today’s tone shows clear downside pressure after the open, which partly contradicts persistent positive momentum on the MACD and CCI.
Earlier, analysts noted that while Tradeweb’s near-term performance showed resiliency, longer-term technical caution prevailed. The recent shift to sustained downside momentum and increased volatility adds a new dimension to the technical outlook, with focus now on whether the $102 support holds as a signal for further weakness or stabilization.






Latest Tradeweb Markets News




-
 Afghanistan
-
 Albania
-
 Algeria
-
 Angola
-
 Argentina
-
 Armenia
-
 Australia
-
 Austria
-
 Azerbaijan
-
 Bahamas
-
 Bahrain
-
 Bangladesh
-
 Belarus
-
 Belgium
-
 Bolivia
-
 Botswana
-
 Brazil
-
 Brunei
-
 Bulgaria
-
 Cambodia
-
 Cameroon
-
 Canada
-
 Chile
-
 China
-
 Colombia
-
 Congo
-
 Costa Rica
-
 Cote d'Ivoire
-
 Croatia
-
 Cuba
-
 Cyprus
-
 Czechia
-
 DR Congo
-
 Denmark
-
 Dominican Republic
-
 Ecuador
-
 Egypt
-
 El Salvador
-
 Estonia
-
 Eswatini
-
 Ethiopia
-
 Finland
-
 France
-
 Georgia
-
 Germany
-
 Ghana
-
 Greece
-
 Haiti
-
 Hong Kong
-
 Hungary
-
 India
-
 Indonesia
-
 Iran, Islamic republic
-
 Iraq
-
 Ireland
-
 Israel
-
 Italy
-
 Jamaica
-
 Japan
-
 Jordan
-
 Kazakhstan
-
 Kenya
-
 Korea
-
 Kuwait
-
 Kyrgyzstan
-
 Laos
-
 Latvia
-
 Lebanon
-
 Lesotho
-
 Libya
-
 Lithuania
-
 Luxembourg
-
 Madagascar
-
 Malaysia
-
 Malta
-
 Mauritius
-
 Mexico
-
 Moldova
-
 Mongolia
-
 Montenegro
-
 Morocco
-
 Mozambique
-
 Myanmar
-
 Namibia
-
 Nepal
-
 Netherlands
-
 New Zealand
-
 Nigeria
-
 North Macedonia
-
 Norway
-
 Oman
-
 Pakistan
-
 Palestine
-
 Panama
-
 Papua New Guinea
-
 Paraguay
-
 Peru
-
 Philippines
-
 Poland
-
 Portugal
-
 Puerto Rico
-
 Qatar
-
 Reunion
-
 Romania
-
 Rwanda
-
 Saudi Arabia
-
 Serbia
-
 Singapore
-
 Slovakia
-
 Slovenia
-
 Somalia
-
 South Africa
-
 Spain
-
 Sri Lanka
-
 Sweden
-
 Switzerland
-
 Syria
-
 Taiwan
-
 Tajikistan
-
 Tanzania
-
 Thailand
-
 Trinidad and Tobago
-
 Tunisia
-
 Turkey
-
 UAE
-
 Uganda
-
 Ukraine
-
 United Kingdom
-
United States
-
 Uruguay
-
 Uzbekistan
-
 Venezuela
-
 Vietnam
-
 Yemen
-
 Zambia
-
 Zimbabwe
- Forex
- Crypto












