

What's behind Quantum Computing's latest stock surge?

Quantum Computing Inc. (QUBT) rose 2.81% on a wave of technical buying pressure, with momentum underpinned by an upside gap and strength near session highs. The move looks limited, as the stock remains below the 50-day and 200-day moving averages, highlighting ongoing resistance despite short-term bullish signals.
 6.64
6.93
Highlights
- Quantum Computing trades above its 20-day average, signaling short-term bullish momentum despite broader medium-term weakness.
- Momentum and trend indicators are mixed, with buyers dominant intraday but overbought and weak-trend signals limiting upside conviction.
- Expected five-day range is $7.79 to $8.87, with a 63% probability of downward movement and consolidation near current levels.
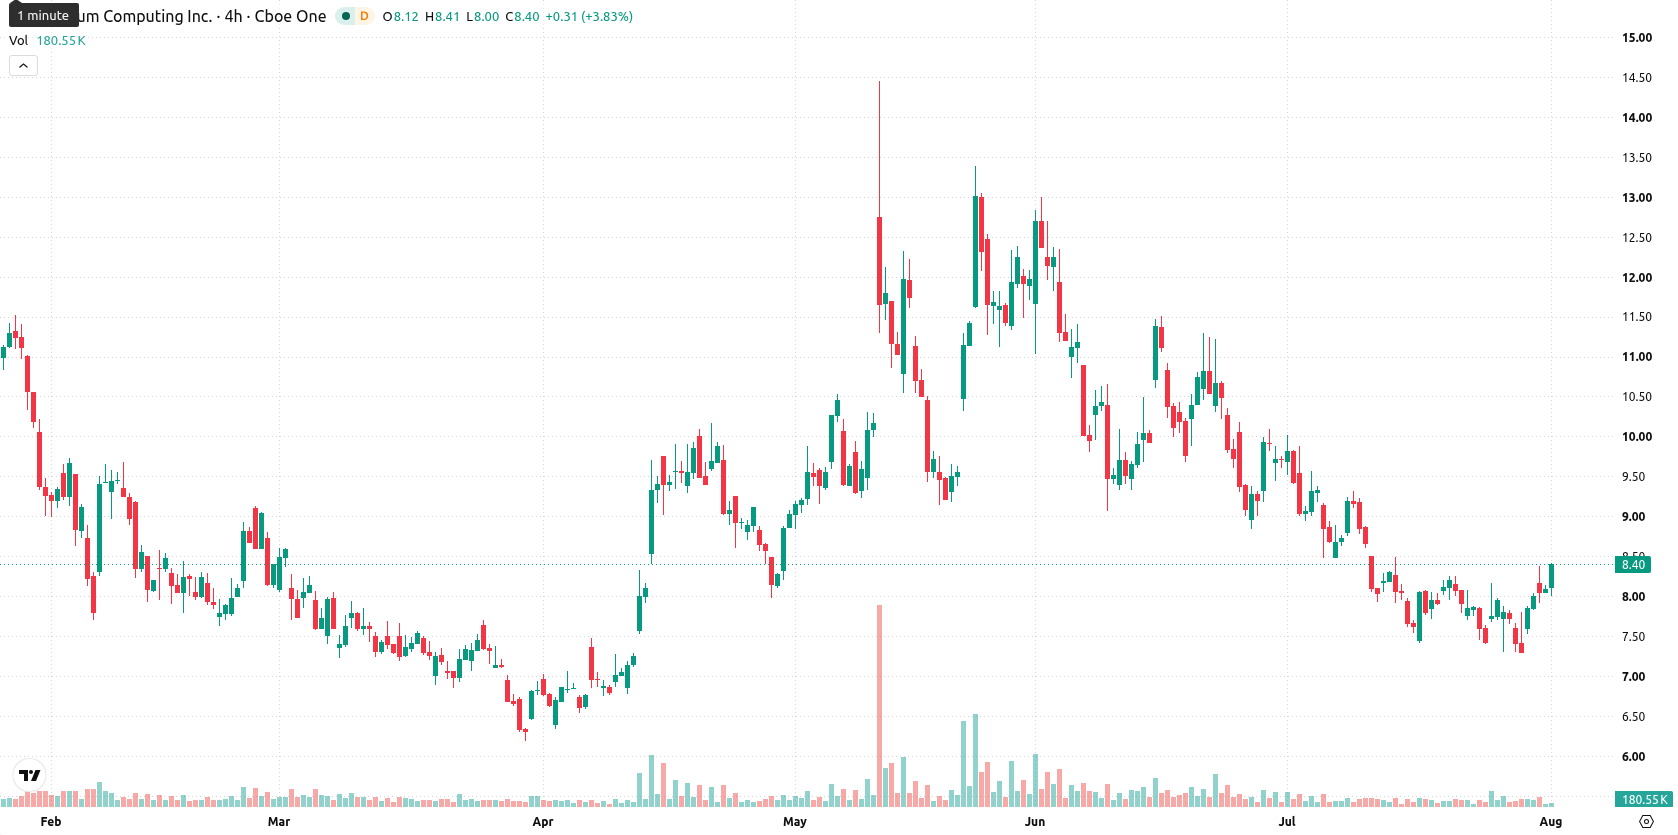
Mixed technicals as short-term momentum diverges from broader weakness
Quantum Computing is trading above its 20-day moving average at $8.14, signaling short-term bullish momentum, but remains below the 50-day and 200-day moving averages at $9.57 and $10.31, which reflects continued medium- and long-term selling pressure. The next resistance stands at $8.38, with support at $8.14, and the Ichimoku Kijun at $8.74 serves as additional resistance. Momentum indicators are mixed: the MACD at -0.54 suggests a strong sell, while the ADX at 12.68 indicates a weak trend. The RSI at 46.36 signals ongoing sell momentum, with the Stochastic RSI at 100 flagging overbought conditions. The Bull/Bear Power of 0.39 points to buyers dominating intraday trades, but this occurs within an overbought environment. Intraday volatility is elevated at 5.81%, and the asset is trading near its session highs, highlighting divergence between short-term buying and broader weakness.
Earlier, analysts noted that advances in quantum computing are accelerating, underscoring mounting security and structural risks in the blockchain and crypto industry. The current technical setup for Quantum Computing Inc. suggests that, while short-term bullish momentum is evident, traders should closely monitor the key resistance level at $8.87 for signs of sustained breakout or renewed downside risk.






Latest Quantum Computing News




-
 Afghanistan
-
 Albania
-
 Algeria
-
 Angola
-
 Argentina
-
 Armenia
-
 Australia
-
 Austria
-
 Azerbaijan
-
 Bahamas
-
 Bahrain
-
 Bangladesh
-
 Belarus
-
 Belgium
-
 Bolivia
-
 Botswana
-
 Brazil
-
 Brunei
-
 Bulgaria
-
 Cambodia
-
 Cameroon
-
 Canada
-
 Chile
-
 China
-
 Colombia
-
 Congo
-
 Costa Rica
-
 Cote d'Ivoire
-
 Croatia
-
 Cuba
-
 Cyprus
-
 Czechia
-
 DR Congo
-
 Denmark
-
 Dominican Republic
-
 Ecuador
-
 Egypt
-
 El Salvador
-
 Estonia
-
 Eswatini
-
 Ethiopia
-
 Finland
-
 France
-
 Georgia
-
 Germany
-
 Ghana
-
 Greece
-
 Haiti
-
 Hong Kong
-
 Hungary
-
 India
-
 Indonesia
-
 Iran, Islamic republic
-
 Iraq
-
 Ireland
-
 Israel
-
 Italy
-
 Jamaica
-
 Japan
-
 Jordan
-
 Kazakhstan
-
 Kenya
-
 Korea
-
 Kuwait
-
 Kyrgyzstan
-
 Laos
-
 Latvia
-
 Lebanon
-
 Lesotho
-
 Libya
-
 Lithuania
-
 Luxembourg
-
 Madagascar
-
 Malaysia
-
 Malta
-
 Mauritius
-
 Mexico
-
 Moldova
-
 Mongolia
-
 Montenegro
-
 Morocco
-
 Mozambique
-
 Myanmar
-
 Namibia
-
 Nepal
-
 Netherlands
-
 New Zealand
-
 Nigeria
-
 North Macedonia
-
 Norway
-
 Oman
-
 Pakistan
-
 Palestine
-
 Panama
-
 Papua New Guinea
-
 Paraguay
-
 Peru
-
 Philippines
-
 Poland
-
 Portugal
-
 Puerto Rico
-
 Qatar
-
 Reunion
-
 Romania
-
 Rwanda
-
 Saudi Arabia
-
 Serbia
-
 Singapore
-
 Slovakia
-
 Slovenia
-
 Somalia
-
 South Africa
-
 Spain
-
 Sri Lanka
-
 Sweden
-
 Switzerland
-
 Syria
-
 Taiwan
-
 Tajikistan
-
 Tanzania
-
 Thailand
-
 Trinidad and Tobago
-
 Tunisia
-
 Turkey
-
 UAE
-
 Uganda
-
 Ukraine
-
 United Kingdom
-
United States
-
 Uruguay
-
 Uzbekistan
-
 Venezuela
-
 Vietnam
-
 Yemen
-
 Zambia
-
 Zimbabwe
- Forex
- Crypto












