

Texas Instruments stock forecast: Pullback signals remain

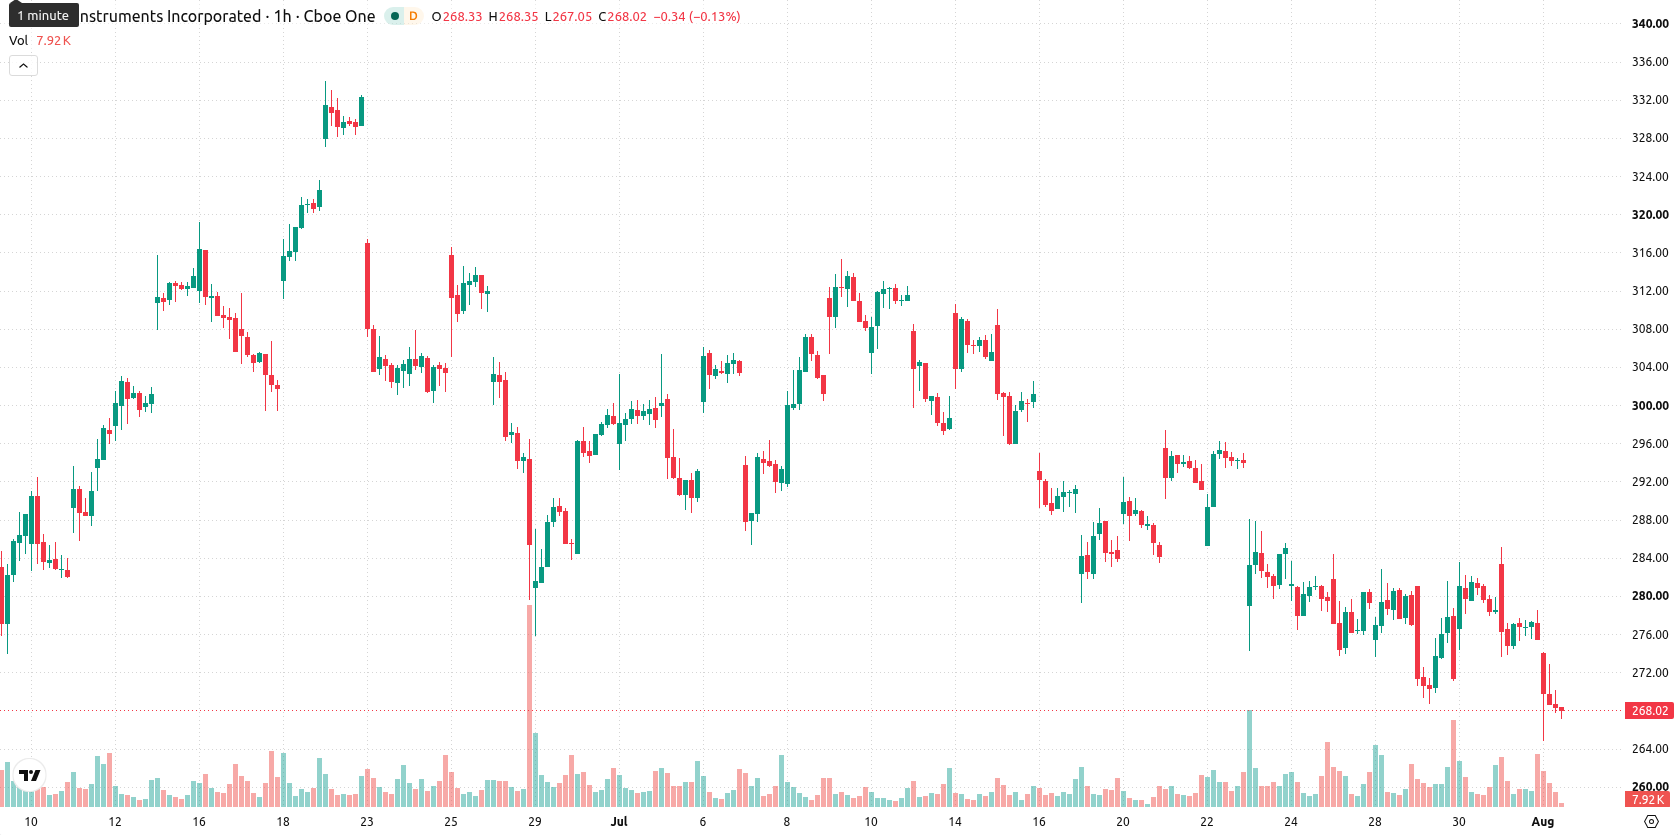
Texas Instruments (TXN) stock is trading at $267.39, posting a daily decline of 3.02% as it closes near its session low. The price is currently sitting below its key short- and medium-term moving averages, indicating downward momentum relative to recent trends.
 282.55
301.00
Highlights
- Texas Instruments trades below key short- and medium-term moving averages, reflecting persistent selling pressure and momentum weakness.
- Oscillator signals indicate an oversold condition, with sellers dominating and only minor risk of a short-term technical rebound.
- The stock is expected to range between $258.04 and $274.02, with a 77% probability of further downside unless immediate resistance breaks.
Bearish momentum confirmed as resistance holds and sellers dominate
On the technical front, TXN is trading below its MA-20 and MA-50 on the hourly chart, which signals short- and medium-term seller pressure. The price remains well above the MA-200 on the daily timeframe, and the Ichimoku Kijun at $275.02 serves as immediate resistance. Momentum indicators reflect a bearish bias: MACD is in Sell mode, ADX is Neutral, and the Awesome Oscillator indicates ongoing selling. RSI is at 36.65, pointing to a Sell bias, while Stoch RSI, CCI, and Bull/Bear Power all confirm oversold conditions and dominant seller momentum.
Downside risk prevails as sideways trading dominates short-term outlook
In the short term, TXN is expected to fluctuate between $258.04 and $274.02, with forecast scenarios indicating a 23% probability of an upward move and a 77% likelihood of further downside. The base case sees the stock trading sideways within this corridor, while a bullish scenario requires a clear breakout above immediate resistance. A bearish outcome may unfold if the price falls below the identified support zone.
Earlier, analysts noted that Texas Instruments was exhibiting mixed technical signals, with persistent underlying bearish momentum despite some signs of short-term recovery. The latest setup confirms intensifying seller dominance, making downside follow-through the prevailing scenario, with traders advised to monitor the $258 area as a critical support level for potential breakdown risk.






Latest Texas Instruments News




-
 Afghanistan
-
 Albania
-
 Algeria
-
 Angola
-
 Argentina
-
 Armenia
-
 Australia
-
 Austria
-
 Azerbaijan
-
 Bahamas
-
 Bahrain
-
 Bangladesh
-
 Belarus
-
 Belgium
-
 Bolivia
-
 Botswana
-
 Brazil
-
 Brunei
-
 Bulgaria
-
 Cambodia
-
 Cameroon
-
 Canada
-
 Chile
-
 China
-
 Colombia
-
 Congo
-
 Costa Rica
-
 Cote d'Ivoire
-
 Croatia
-
 Cuba
-
 Cyprus
-
 Czechia
-
 DR Congo
-
 Denmark
-
 Dominican Republic
-
 Ecuador
-
 Egypt
-
 El Salvador
-
 Estonia
-
 Eswatini
-
 Ethiopia
-
 Finland
-
 France
-
 Georgia
-
 Germany
-
 Ghana
-
 Greece
-
 Haiti
-
 Hong Kong
-
 Hungary
-
 India
-
 Indonesia
-
 Iran, Islamic republic
-
 Iraq
-
 Ireland
-
 Israel
-
 Italy
-
 Jamaica
-
 Japan
-
 Jordan
-
 Kazakhstan
-
 Kenya
-
 Korea
-
 Kuwait
-
 Kyrgyzstan
-
 Laos
-
 Latvia
-
 Lebanon
-
 Lesotho
-
 Libya
-
 Lithuania
-
 Luxembourg
-
 Madagascar
-
 Malaysia
-
 Malta
-
 Mauritius
-
 Mexico
-
 Moldova
-
 Mongolia
-
 Montenegro
-
 Morocco
-
 Mozambique
-
 Myanmar
-
 Namibia
-
 Nepal
-
 Netherlands
-
 New Zealand
-
 Nigeria
-
 North Macedonia
-
 Norway
-
 Oman
-
 Pakistan
-
 Palestine
-
 Panama
-
 Papua New Guinea
-
 Paraguay
-
 Peru
-
 Philippines
-
 Poland
-
 Portugal
-
 Puerto Rico
-
 Qatar
-
 Reunion
-
 Romania
-
 Rwanda
-
 Saudi Arabia
-
 Serbia
-
 Singapore
-
 Slovakia
-
 Slovenia
-
 Somalia
-
 South Africa
-
 Spain
-
 Sri Lanka
-
 Sweden
-
 Switzerland
-
 Syria
-
 Taiwan
-
 Tajikistan
-
 Tanzania
-
 Thailand
-
 Trinidad and Tobago
-
 Tunisia
-
 Turkey
-
 UAE
-
 Uganda
-
 Ukraine
-
 United Kingdom
-
United States
-
 Uruguay
-
 Uzbekistan
-
 Venezuela
-
 Vietnam
-
 Yemen
-
 Zambia
-
 Zimbabwe
- Forex
- Crypto












