

Nano Dimension shares technical analysis: $1.68 resistance test in focus

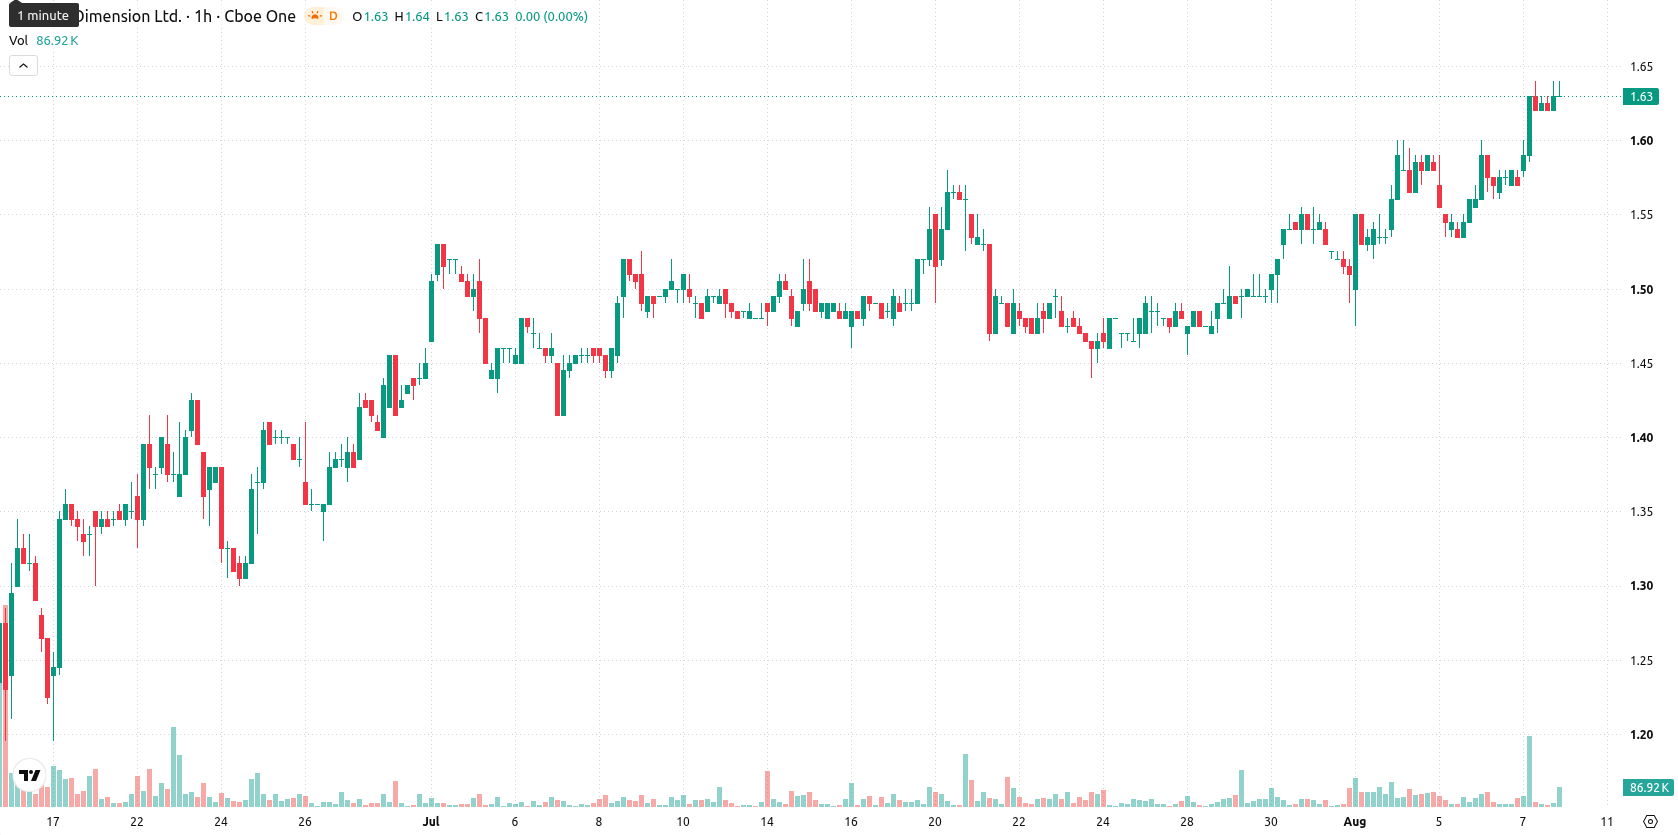
Nano Dimension (NNDM) stock is trading at $1.63, up 3.82% on the day. The price stands above its key short- and medium-term moving averages, indicating upward momentum, yet remains below the longer-term average.
 1.28
1.38
Highlights
- Shares of NNDM show a strong short- and medium-term bullish trend, but longer-term momentum remains negative.
- Firm momentum and dominant intraday buyers are signaled by multiple indicators, though some oscillators warn of overbought conditions and exhaustion risk.
- Price is expected to consolidate in the $1.55 to $1.71 range over the next few days, with a breakout above resistance likely to drive further gains.
Bullish signals persist as upward volatility tests resistance
On the technical front, NNDM has surpassed the MA-20 at $1.59 and MA-50 at $1.56, but has not reclaimed the MA-200 at $1.68. The Ichimoku Kijun level at $1.59 offers immediate support. Momentum indicators are bullish: MACD and ADX signal buy conditions, while RSI at 65.45 and CCI register in overbought territory, hinting at some upside exhaustion. Stoch RSI is neutral, Bull/Bear Power shows strong buyer control intraday, and the Awesome Oscillator trend is positive. Price action includes a 0.03 gap higher with trading near today's high, supported by elevated volatility, though caution is warranted given stretched oscillators.
Consolidation expected as breakout risk shapes near-term outlook
Looking ahead to the next few days, NNDM is projected to trade within a $1.55–$1.71 band. The base case expects consolidation within this range, with a high probability of upward continuation. A breakout above the upper boundary may trigger further gains, while a drop below immediate support at $1.59 would expose downside risk toward the lower end of the forecast range.
Earlier, analysts noted that Nano Dimension was exhibiting mixed technical momentum with gains facing significant resistance and the potential for consolidation persisting. The current analysis reaffirms this outlook, highlighting that while upward momentum prevails above key moving averages, traders should watch for a breakout above $1.71 or a retreat below $1.59 as pivotal signals for the next directional move.






Latest Nano Dimension News





-
 Afghanistan
-
 Albania
-
 Algeria
-
 Angola
-
 Argentina
-
 Armenia
-
 Australia
-
 Austria
-
 Azerbaijan
-
 Bahamas
-
 Bahrain
-
 Bangladesh
-
 Belarus
-
 Belgium
-
 Bolivia
-
 Botswana
-
 Brazil
-
 Brunei
-
 Bulgaria
-
 Cambodia
-
 Cameroon
-
 Canada
-
 Chile
-
 China
-
 Colombia
-
 Congo
-
 Costa Rica
-
 Cote d'Ivoire
-
 Croatia
-
 Cuba
-
 Cyprus
-
 Czechia
-
 DR Congo
-
 Denmark
-
 Dominican Republic
-
 Ecuador
-
 Egypt
-
 El Salvador
-
 Estonia
-
 Eswatini
-
 Ethiopia
-
 Finland
-
 France
-
 Georgia
-
 Germany
-
 Ghana
-
 Greece
-
 Haiti
-
 Hong Kong
-
 Hungary
-
 India
-
 Indonesia
-
 Iran, Islamic republic
-
 Iraq
-
 Ireland
-
 Israel
-
 Italy
-
 Jamaica
-
 Japan
-
 Jordan
-
 Kazakhstan
-
 Kenya
-
 Korea
-
 Kuwait
-
 Kyrgyzstan
-
 Laos
-
 Latvia
-
 Lebanon
-
 Lesotho
-
 Libya
-
 Lithuania
-
 Luxembourg
-
 Madagascar
-
 Malaysia
-
 Malta
-
 Mauritius
-
 Mexico
-
 Moldova
-
 Mongolia
-
 Montenegro
-
 Morocco
-
 Mozambique
-
 Myanmar
-
 Namibia
-
 Nepal
-
 Netherlands
-
 New Zealand
-
 Nigeria
-
 North Macedonia
-
 Norway
-
 Oman
-
 Pakistan
-
 Palestine
-
 Panama
-
 Papua New Guinea
-
 Paraguay
-
 Peru
-
 Philippines
-
 Poland
-
 Portugal
-
 Puerto Rico
-
 Qatar
-
 Reunion
-
 Romania
-
 Rwanda
-
 Saudi Arabia
-
 Serbia
-
 Singapore
-
 Slovakia
-
 Slovenia
-
 Somalia
-
 South Africa
-
 Spain
-
 Sri Lanka
-
 Sweden
-
 Switzerland
-
 Syria
-
 Taiwan
-
 Tajikistan
-
 Tanzania
-
 Thailand
-
 Trinidad and Tobago
-
 Tunisia
-
 Turkey
-
 UAE
-
 Uganda
-
 Ukraine
-
 United Kingdom
-
United States
-
 Uruguay
-
 Uzbekistan
-
 Venezuela
-
 Vietnam
-
 Yemen
-
 Zambia
-
 Zimbabwe
- Forex
- Crypto












