


Schlumberger NV (SLB) surged 3.87% on strong technical momentum and persistent buying pressure, as bulls drove the stock higher in the absence of fresh company news. The move is supported by its position above all key moving averages, confirming a bullish trend structure.
 49.77
49.77
49.77
49.77
Highlights
- Schlumberger stock is trading in a bullish structure above key moving averages with strong short- and medium-term trends.
- Momentum indicators are mixed, with buy signals from MACD and CCI offset by overbought signals in Stochastic RSI and a neutral ADX.
- Over the next five days, the projected range is $50.69 to $54.3, with a 76% probability for upward movement.
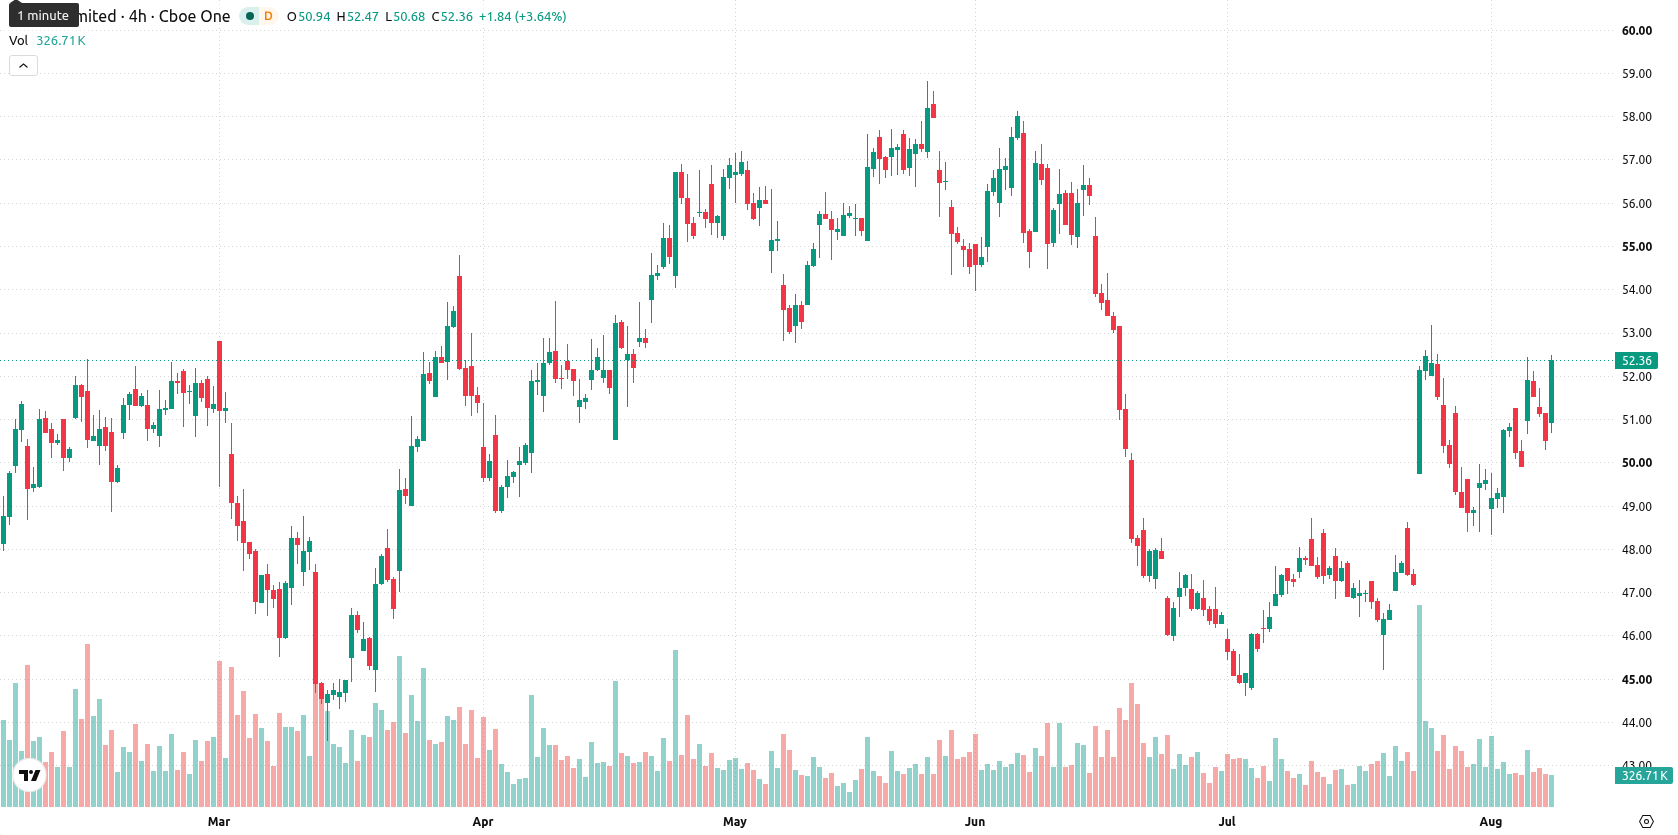
Bullish structure confirmed as mixed momentum signals emerge
Schlumberger is trading firmly above its 20-day, 50-day, and 200-day moving averages at $48.89, $50.17, and $47.19. This price positioning confirms a bullish structure with support for short-, medium-, and long-term trends, backed by a bullish MA-50 vs MA-200 alignment. The nearest technical ceiling is at $54.3, with a floor at $52.45. Momentum is supported by the Moving Average Convergence Divergence (MACD) signaling buy, although the Average Directional Index (ADX) remains neutral, indicating trend strength is still developing. The Relative Strength Index (RSI) sits at 54.42, suggesting healthy momentum, while Stochastic RSI points to overbought conditions and the Commodity Channel Index (CCI) remains in buy territory. Bull/Bear Power (BBP) is positive at 1.94, confirming buyers dominate current momentum with an overbought signal. The Awesome Oscillator also aligns with the current uptrend. The stock is up $1.96 or 3.87%, rising after an upside gap of $0.35 (0.69%), and is trading near session highs amid a daily volatility amplitude of 3.09%. This reflects broad strength toward highs, even as some indicators show mixed short-term signals.
Earlier, analysts noted that Schlumberger was demonstrating strong bullish momentum and outperformance of key technical benchmarks. The current analysis reinforces this trend with continued buying pressure and highlights $54.30 as a key resistance level to monitor for a potential breakout.





Latest Schlumberger News






-
 Afghanistan
-
 Albania
-
 Algeria
-
 Angola
-
 Argentina
-
 Armenia
-
 Australia
-
 Austria
-
 Azerbaijan
-
 Bahamas
-
 Bahrain
-
 Bangladesh
-
 Belarus
-
 Belgium
-
 Bolivia
-
 Botswana
-
 Brazil
-
 Brunei
-
 Bulgaria
-
 Cambodia
-
 Cameroon
-
 Canada
-
 Chile
Chile
-
 China
China
-
 Colombia
-
 Congo
Congo
-
 Costa Rica
-
 Cote d'Ivoire
-
 Croatia
-
 Cuba
Cuba
-
 Cyprus
-
 Czechia
-
 DR Congo
-
 Denmark
-
 Dominican Republic
-
 Ecuador
-
 Egypt
Egypt
-
 El Salvador
-
 Estonia
-
 Eswatini
-
 Ethiopia
-
 Finland
-
 France
-
 Georgia
-
 Germany
-
 Ghana
Ghana
-
 Greece
-
 Haiti
Haiti
-
 Hong Kong
-
 Hungary
-
 India
India
-
 Indonesia
-
 Iran, Islamic republic
-
 Iraq
Iraq
-
 Ireland
-
 Israel
-
 Italy
Italy
-
 Jamaica
-
 Japan
Japan
-
 Jordan
-
 Kazakhstan
-
 Kenya
Kenya
-
 Korea
Korea
-
 Kuwait
-
 Kyrgyzstan
-
 Laos
Laos
-
 Latvia
-
 Lebanon
-
 Lesotho
-
 Libya
Libya
-
 Lithuania
-
 Luxembourg
-
 Madagascar
-
 Malaysia
-
 Malta
Malta
-
 Mauritius
-
 Mexico
-
 Moldova
-
 Mongolia
-
 Montenegro
-
 Morocco
-
 Mozambique
-
 Myanmar
-
 Namibia
-
 Nepal
Nepal
-
 Netherlands
-
 New Zealand
-
 Nigeria
-
 North Macedonia
-
 Norway
-
 Oman
Oman
-
 Pakistan
-
 Palestine
-
 Panama
-
 Papua New Guinea
-
 Paraguay
-
 Peru
Peru
-
 Philippines
-
 Poland
-
 Portugal
-
 Puerto Rico
-
 Qatar
Qatar
-
 Reunion
-
 Romania
-
 Rwanda
-
 Saudi Arabia
-
 Serbia
-
 Singapore
-
 Slovakia
-
 Slovenia
-
 Somalia
-
 South Africa
-
 Spain
Spain
-
 Sri Lanka
-
 Sweden
-
 Switzerland
-
 Syria
Syria
-
 Taiwan
-
 Tajikistan
-
 Tanzania
-
 Thailand
-
 Trinidad and Tobago
-
 Tunisia
-
 Turkey
-
 UAE
UAE
-
 Uganda
-
 Ukraine
-
 United Kingdom
-
United States
-
 Uruguay
-
 Uzbekistan
-
 Venezuela
-
 Vietnam
-
 Yemen
Yemen
-
 Zambia
-
 Zimbabwe
- Forex
- Crypto












