

APA shares surge over 8% as bullish momentum fuels rally

APA Corporation (APA) surged 8.16% on the day, driven by strong technical momentum and robust buyer interest in the absence of fresh corporate news. The move is supported by bullish signals across all major moving averages and continued upward momentum, even as overbought risks begin to emerge.
 52.94
52.94
Highlights
- APA stock maintains a bullish structure as it trades above key short, medium, and long-term moving averages.
- Momentum indicators point to continued buying strength, but multiple signals warn conditions are overbought near session highs.
- Shares are likely to consolidate in a $39.02 to $44.47 range over the next five trading days, with a high probability of an upward move.
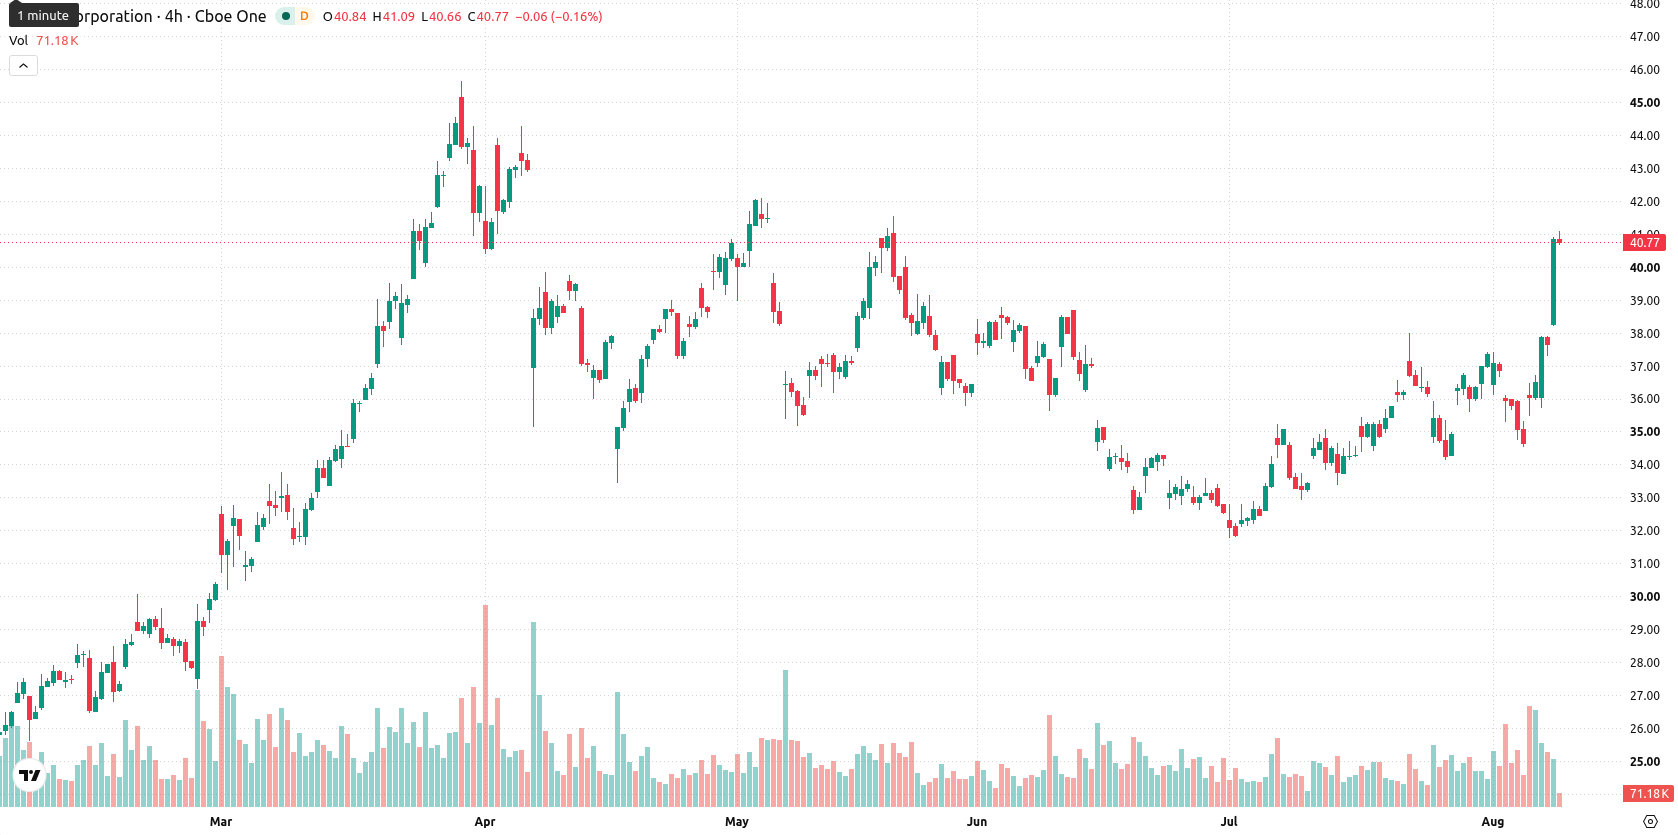
Bull trend confirmed as price nears resistance and overbought signals grow
APA is trading above its 20-day ($35.69), 50-day ($35.27), and 200-day ($31.68) moving averages, confirming a bullish structure across short, medium, and long-term trends. The near-term ceiling stands at $41.08, with immediate support at $39.02, supporting a continuation of upward momentum. Momentum signals are positive, with MACD indicating a buy and Average Directional Index (ADX) remaining neutral. Relative Strength Index (RSI) is at 59.06, trending toward buy territory, but Stochastic RSI (87.77), Commodity Channel Index (CCI) (114.49), and Bull/Bear Power (BBP) (1.82) all highlight overbought conditions. BBP above zero confirms buyers are dominating the session, with the forecast also marked as overbought. The Awesome Oscillator is neutral. The stock is currently at $40.7, up $3.07 or 8.16% on the day, following an upside gap of $0.63 (1.67%). Price is near the session high with intraday volatility at 7.37%. The session shows strong upward tone and firm interest from buyers.
Earlier, analysts noted that APA’s technical setup was mixed, with the stock at a critical juncture and traders awaiting a decisive directional move. The current breakout confirms a strong bullish reversal and places focus on whether APA can sustain momentum above $41.08 to extend its advance toward the upper end of the projected range.






Latest APA Corporation News





-
 Afghanistan
-
 Albania
-
 Algeria
-
 Angola
-
 Argentina
-
 Armenia
-
 Australia
-
 Austria
-
 Azerbaijan
-
 Bahamas
-
 Bahrain
-
 Bangladesh
-
 Belarus
-
 Belgium
-
 Bolivia
-
 Botswana
-
 Brazil
-
 Brunei
-
 Bulgaria
-
 Cambodia
-
 Cameroon
-
 Canada
-
 Chile
-
 China
-
 Colombia
-
 Congo
-
 Costa Rica
-
 Cote d'Ivoire
-
 Croatia
-
 Cuba
-
 Cyprus
-
 Czechia
-
 DR Congo
-
 Denmark
-
 Dominican Republic
-
 Ecuador
-
 Egypt
-
 El Salvador
-
 Estonia
-
 Eswatini
-
 Ethiopia
-
 Finland
-
 France
-
 Georgia
-
 Germany
-
 Ghana
-
 Greece
-
 Haiti
-
 Hong Kong
-
 Hungary
-
 India
-
 Indonesia
-
 Iran, Islamic republic
-
 Iraq
-
 Ireland
-
 Israel
-
 Italy
-
 Jamaica
-
 Japan
-
 Jordan
-
 Kazakhstan
-
 Kenya
-
 Korea
-
 Kuwait
-
 Kyrgyzstan
-
 Laos
-
 Latvia
-
 Lebanon
-
 Lesotho
-
 Libya
-
 Lithuania
-
 Luxembourg
-
 Madagascar
-
 Malaysia
-
 Malta
-
 Mauritius
-
 Mexico
-
 Moldova
-
 Mongolia
-
 Montenegro
-
 Morocco
-
 Mozambique
-
 Myanmar
-
 Namibia
-
 Nepal
-
 Netherlands
-
 New Zealand
-
 Nigeria
-
 North Macedonia
-
 Norway
-
 Oman
-
 Pakistan
-
 Palestine
-
 Panama
-
 Papua New Guinea
-
 Paraguay
-
 Peru
-
 Philippines
-
 Poland
-
 Portugal
-
 Puerto Rico
-
 Qatar
-
 Reunion
-
 Romania
-
 Rwanda
-
 Saudi Arabia
-
 Serbia
-
 Singapore
-
 Slovakia
-
 Slovenia
-
 Somalia
-
 South Africa
-
 Spain
-
 Sri Lanka
-
 Sweden
-
 Switzerland
-
 Syria
-
 Taiwan
-
 Tajikistan
-
 Tanzania
-
 Thailand
-
 Trinidad and Tobago
-
 Tunisia
-
 Turkey
-
 UAE
-
 Uganda
-
 Ukraine
-
 United Kingdom
-
United States
-
 Uruguay
-
 Uzbekistan
-
 Venezuela
-
 Vietnam
-
 Yemen
-
 Zambia
-
 Zimbabwe
- Forex
- Crypto












