


TE Connectivity Ltd (TEL) advanced 3.24% today as bullish technical momentum and persistent intraday strength attracted buyers in the absence of any fresh corporate catalysts. The immediate uptrend is supported by prices holding above all key moving averages, even as mixed oscillator signals hint at potential short-term caution.
 219.57
230.00
Highlights
- Shares of TE Connectivity are showing strong upward momentum as they trade above key short-, medium-, and long-term moving averages.
- Technical indicators present a mixed picture with most supporting further gains but the Stochastic RSI warning of a possible short-term pullback.
- For the next five trading days, the expected price range is $217.28 to $225.16 with a 67% probability of an upward move.
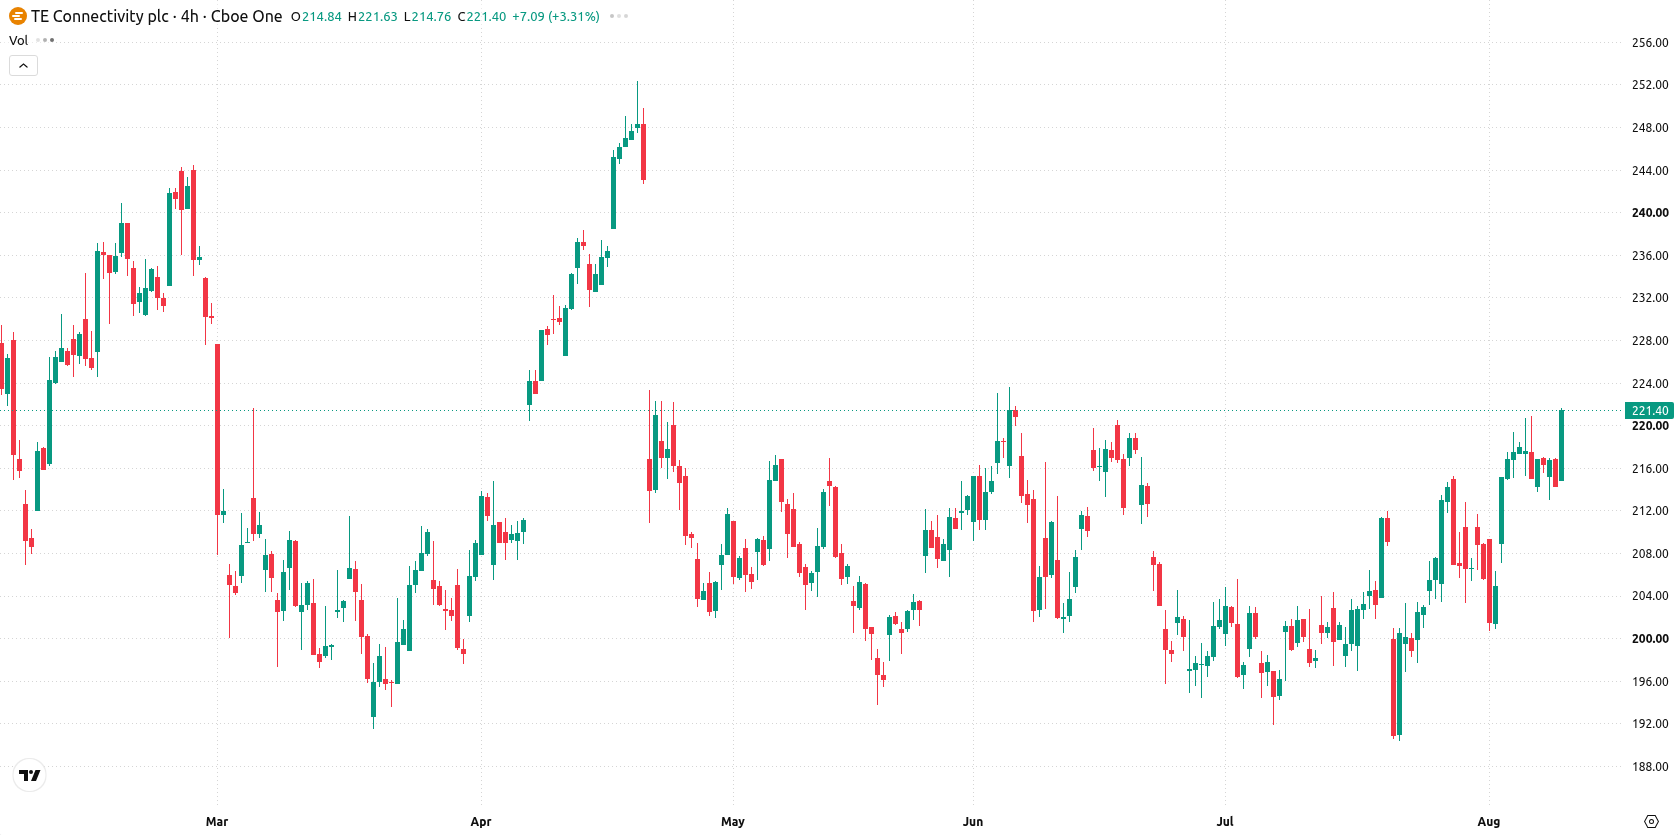
Bullish alignment holds as divergent momentum indicators create tension
TE Connectivity is trading above the 20-day ($207.45), 50-day ($206.84), and 200-day ($219.40) moving averages, indicating bullish momentum across short, medium, and long-term trends. The near-term floor is at $220.90 and the ceiling is set at $225.16. The 50 vs 200-day alignment hints at a bearish longer-term structure, but immediate trend strength dominates. Momentum remains firm: the MACD signals a “Buy”, the Average Directional Index (ADX) is neutral, and the RSI at 57.2 alongside the Commodity Channel Index (CCI) support further upside without overbought warnings. However, the Stochastic RSI signals a strong sell, introducing divergence with other indicators. Bull/Bear Power (BBP) is at 5.98, confirming buyer dominance and suggesting overbought intraday conditions, while the Awesome Oscillator supports the uptrend. Intraday volatility is 2.86%, underlining persistent strength toward session highs against a backdrop of mixed signals.
Previously it was reported that TE Connectivity shares faced strong downward pressure despite robust earnings, with a firmly bearish technical structure dominating the outlook. The current upward momentum introduces a potential shift in trend, and traders should closely monitor a sustained close above $225.16 as a trigger for further upside beyond the established range.






Latest TE Connectivity Ltd News




-
 Afghanistan
-
 Albania
-
 Algeria
-
 Angola
-
 Argentina
-
 Armenia
-
 Australia
-
 Austria
-
 Azerbaijan
-
 Bahamas
-
 Bahrain
-
 Bangladesh
-
 Belarus
-
 Belgium
-
 Bolivia
-
 Botswana
-
 Brazil
-
 Brunei
-
 Bulgaria
-
 Cambodia
-
 Cameroon
-
 Canada
-
 Chile
-
 China
-
 Colombia
-
 Congo
-
 Costa Rica
-
 Cote d'Ivoire
-
 Croatia
-
 Cuba
-
 Cyprus
-
 Czechia
-
 DR Congo
-
 Denmark
-
 Dominican Republic
-
 Ecuador
-
 Egypt
-
 El Salvador
-
 Estonia
-
 Eswatini
-
 Ethiopia
-
 Finland
-
 France
-
 Georgia
-
 Germany
-
 Ghana
-
 Greece
-
 Haiti
-
 Hong Kong
-
 Hungary
-
 India
-
 Indonesia
-
 Iran, Islamic republic
-
 Iraq
-
 Ireland
-
 Israel
-
 Italy
-
 Jamaica
-
 Japan
-
 Jordan
-
 Kazakhstan
-
 Kenya
-
 Korea
-
 Kuwait
-
 Kyrgyzstan
-
 Laos
-
 Latvia
-
 Lebanon
-
 Lesotho
-
 Libya
-
 Lithuania
-
 Luxembourg
-
 Madagascar
-
 Malaysia
-
 Malta
-
 Mauritius
-
 Mexico
-
 Moldova
-
 Mongolia
-
 Montenegro
-
 Morocco
-
 Mozambique
-
 Myanmar
-
 Namibia
-
 Nepal
-
 Netherlands
-
 New Zealand
-
 Nigeria
-
 North Macedonia
-
 Norway
-
 Oman
-
 Pakistan
-
 Palestine
-
 Panama
-
 Papua New Guinea
-
 Paraguay
-
 Peru
-
 Philippines
-
 Poland
-
 Portugal
-
 Puerto Rico
-
 Qatar
-
 Reunion
-
 Romania
-
 Rwanda
-
 Saudi Arabia
-
 Serbia
-
 Singapore
-
 Slovakia
-
 Slovenia
-
 Somalia
-
 South Africa
-
 Spain
-
 Sri Lanka
-
 Sweden
-
 Switzerland
-
 Syria
-
 Taiwan
-
 Tajikistan
-
 Tanzania
-
 Thailand
-
 Trinidad and Tobago
-
 Tunisia
-
 Turkey
-
 UAE
-
 Uganda
-
 Ukraine
-
 United Kingdom
-
United States
-
 Uruguay
-
 Uzbekistan
-
 Venezuela
-
 Vietnam
-
 Yemen
-
 Zambia
-
 Zimbabwe
- Forex
- Crypto












