

AMTM slides nearly 7% as investors react to bearish technical structure and ongoing selling pressure

Amentum Holdings LLC (AMTM) fell 6.84% after reporting fiscal Q3 2026 results featuring raised full-year guidance and substantial contract wins, as investors reacted to a revenue decline and a neutral-to-positive market assessment. The downside is supported by the stock's continued position below its 200-day moving average and a bearish mid-to-long-term technical structure.
 22.42
22.49
Highlights
- Amentum posted fiscal third-quarter 2026 revenue of $3.5 billion, net income of $66 million, adjusted EBITDA of $290 million, and free cash flow of $135 million.
- The company increased 2026 guidance for adjusted EBITDA and adjusted diluted EPS, citing strong performance and major contract wins in nuclear energy, digital infrastructure, and classified segments.
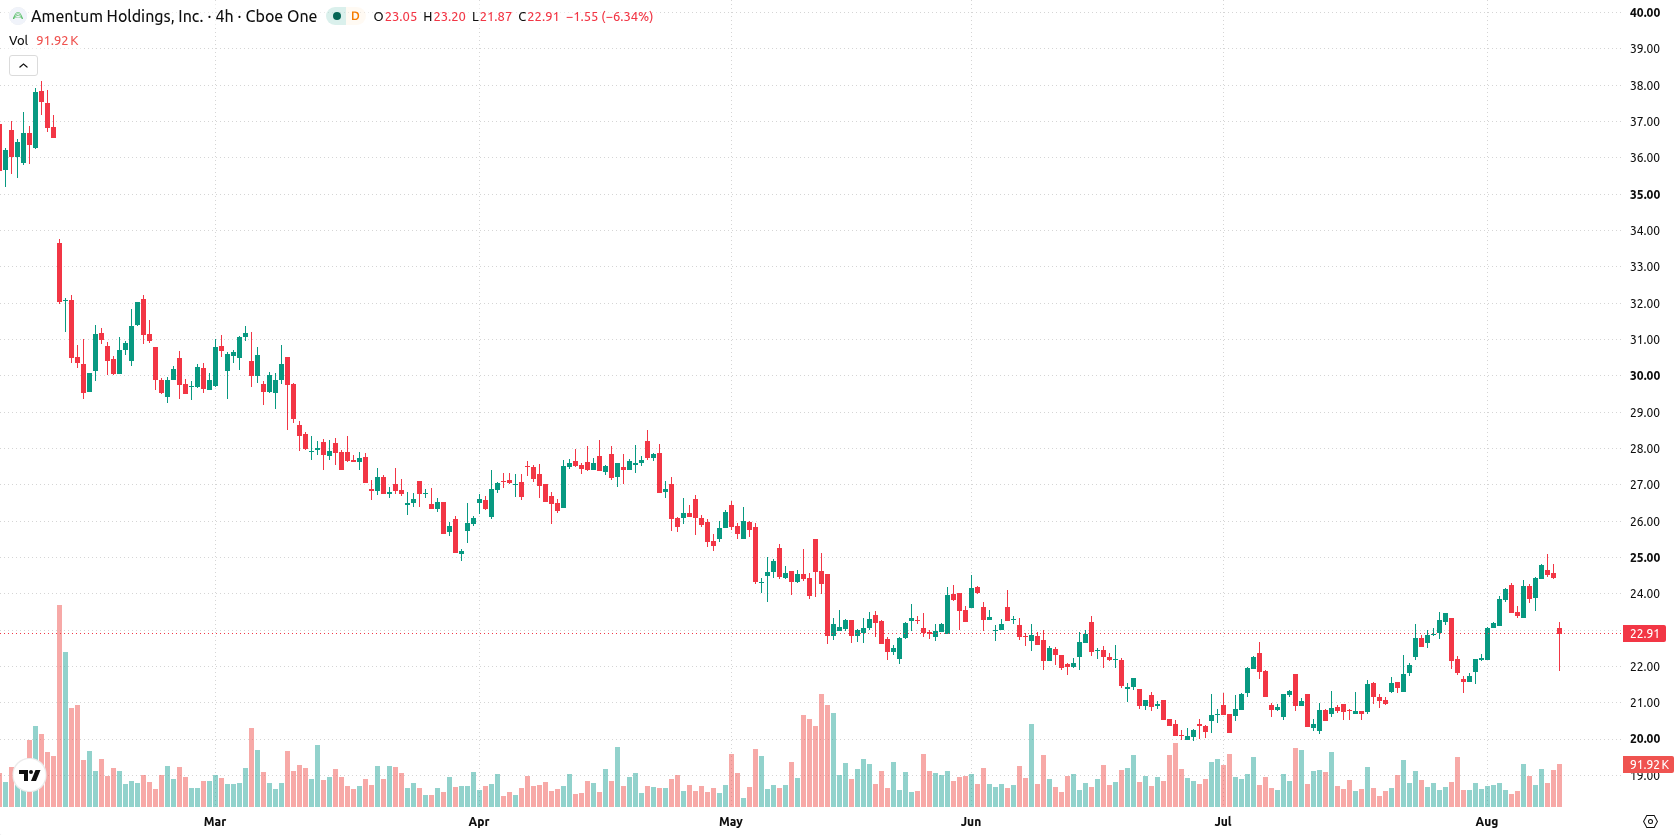
- Shares of Amentum recently declined 6.84% to $22.75, with technical signals showing mixed momentum and an expected range of $21.86 to $24.37 over the next five days.
Investor caution persists amid higher guidance and strong backlog
Amentum reported fiscal third-quarter 2026 revenue of approximately $3.5 billion, net income of $66 million, adjusted EBITDA of $290 million, and free cash flow of $135 million. The company raised its 2026 guidance for adjusted EBITDA and adjusted diluted EPS, citing strong year-to-date performance and major new contract awards across nuclear energy, digital infrastructure, and classified sectors. Institutional investors and analysts maintained generally neutral to positive sentiment in light of a 2% year-over-year revenue decline, improved EBITDA margin, and a report of $48.2 billion in backlog, though price action has remained under broader selling pressure.
Bullish momentum clashes with overbought signals and resistance limits
Amentum is trading above its 20-day and 50-day moving averages at $22.33 and $21.97 respectively, yet remains below the 200-day moving average at $26.52. This positioning points to near-term and mid-term resilience, but longer-term trend pressure persists, supported by a bearish MA-50 versus MA-200 alignment. The Ichimoku Kijun at $22.61 serves as the nearest floor, with immediate resistance marked by today's high at $23.13. Momentum signals are mixed: the Moving Average Convergence Divergence (MACD) and Average Directional Index (ADX) forecast further upside, while the Relative Strength Index (RSI) suggests a buy. However, the Stochastic RSI flags a strong sell and both the Commodity Channel Index (CCI) and Bull/Bear Power (BBP) show overbought conditions. BBP is positive, indicating buyers dominate intraday activity, and the Awesome Oscillator (AO) also points higher. Despite these bullish signals, the stock has declined $1.67 (6.84%) to $22.75, posting a downside gap of roughly $1.37 (5.61%) and is trading near the upper end of today's $21.94–$23.13 range. Intraday volatility stands at 5.42%, with the tone showing pockets of strength near the highs after opening under pressure. The divergence between overbought oscillators and bullish momentum signals may cap immediate gains.
Earlier, analysts noted that Amentum demonstrated near-term and medium-term technical strength despite ongoing pressure from its longer-term trend. The latest results add nuance by highlighting persistent volatility and mixed momentum signals, making the $22.61 Ichimoku level a crucial pivot to monitor for potential shifts in the coming sessions.






Latest Amentum Holdings LLC News





-
 Afghanistan
-
 Albania
-
 Algeria
-
 Angola
-
 Argentina
-
 Armenia
-
 Australia
-
 Austria
-
 Azerbaijan
-
 Bahamas
-
 Bahrain
-
 Bangladesh
-
 Belarus
-
 Belgium
-
 Bolivia
-
 Botswana
-
 Brazil
-
 Brunei
-
 Bulgaria
-
 Cambodia
-
 Cameroon
-
 Canada
-
 Chile
-
 China
-
 Colombia
-
 Congo
-
 Costa Rica
-
 Cote d'Ivoire
-
 Croatia
-
 Cuba
-
 Cyprus
-
 Czechia
-
 DR Congo
-
 Denmark
-
 Dominican Republic
-
 Ecuador
-
 Egypt
-
 El Salvador
-
 Estonia
-
 Eswatini
-
 Ethiopia
-
 Finland
-
 France
-
 Georgia
-
 Germany
-
 Ghana
-
 Greece
-
 Haiti
-
 Hong Kong
-
 Hungary
-
 India
-
 Indonesia
-
 Iran, Islamic republic
-
 Iraq
-
 Ireland
-
 Israel
-
 Italy
-
 Jamaica
-
 Japan
-
 Jordan
-
 Kazakhstan
-
 Kenya
-
 Korea
-
 Kuwait
-
 Kyrgyzstan
-
 Laos
-
 Latvia
-
 Lebanon
-
 Lesotho
-
 Libya
-
 Lithuania
-
 Luxembourg
-
 Madagascar
-
 Malaysia
-
 Malta
-
 Mauritius
-
 Mexico
-
 Moldova
-
 Mongolia
-
 Montenegro
-
 Morocco
-
 Mozambique
-
 Myanmar
-
 Namibia
-
 Nepal
-
 Netherlands
-
 New Zealand
-
 Nigeria
-
 North Macedonia
-
 Norway
-
 Oman
-
 Pakistan
-
 Palestine
-
 Panama
-
 Papua New Guinea
-
 Paraguay
-
 Peru
-
 Philippines
-
 Poland
-
 Portugal
-
 Puerto Rico
-
 Qatar
-
 Reunion
-
 Romania
-
 Rwanda
-
 Saudi Arabia
-
 Serbia
-
 Singapore
-
 Slovakia
-
 Slovenia
-
 Somalia
-
 South Africa
-
 Spain
-
 Sri Lanka
-
 Sweden
-
 Switzerland
-
 Syria
-
 Taiwan
-
 Tajikistan
-
 Tanzania
-
 Thailand
-
 Trinidad and Tobago
-
 Tunisia
-
 Turkey
-
 UAE
-
 Uganda
-
 Ukraine
-
 United Kingdom
-
United States
-
 Uruguay
-
 Uzbekistan
-
 Venezuela
-
 Vietnam
-
 Yemen
-
 Zambia
-
 Zimbabwe
- Forex
- Crypto












