

Constellation Energy stock forecast: Breakout attempt targets $304.52 resistance

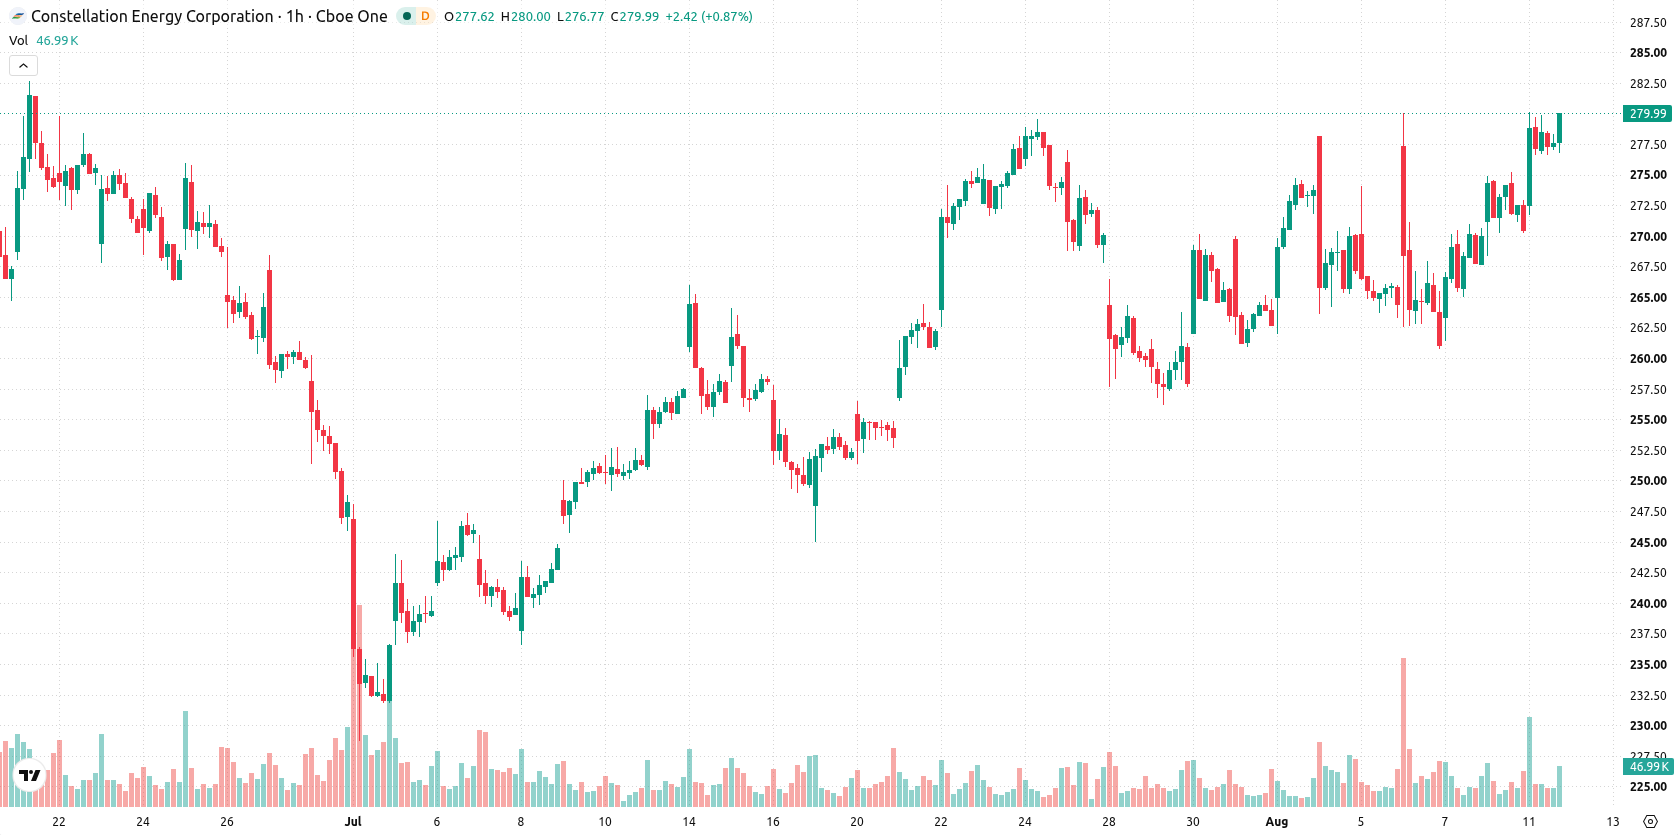
Constellation Energy (CEG) stock is trading at $279.88 after moving up 3.49% on the day. The price sits above its key short- and medium-term moving averages but remains below the longer-term average.
 266.76
266.80
Highlights
- Constellation Energy increased its full-year 2026 adjusted operating earnings guidance to $11.50 to $12.50 per share.
- The company completed $2.2 billion in share repurchases year to date with $2.8 billion still authorized, decreasing outstanding shares.
- Shares of Constellation Energy are trading with a bullish short- and medium-term bias, projected to trade in a $271.24 to $288.52 range with a 77% probability of an upward move.
Earnings outlook and buybacks drive long-term optimism amid mixed results
Constellation Energy raised its full-year 2026 adjusted operating earnings guidance to $11.50–$12.50 per share, a development that underscores improved commercial prospects and drives greater investor demand for the stock, according to Barchart. The company’s year-to-date completion of $2.2 billion in share repurchases, with $2.8 billion remaining under authorization, directly reduces the outstanding float and mechanically supports per-share value, as also reported by Barchart. Most of Constellation Energy’s nuclear generation output is now contracted through 2050 and beyond, ensuring long-term revenue stability, while recent regulatory filings for license renewals at key reactors further extend operational security. Adjusted operating earnings outperformed expectations in the second quarter of 2026, even as total revenue missed consensus and GAAP net income declined, according to Tradingkey.
Positive momentum faces overbought risks as buyers dominate
On the hourly chart, CEG is trading above the MA-20 at $272.57 and MA-50 at $269.40, while still remaining below the daily MA-200 at $304.52. The Ichimoku Kijun level at $270.26 represents immediate support for the current trend. Momentum indicators such as MACD and ADX suggest a positive bias, with RSI reading 60.82 in a moderate buy zone. However, CCI and Bull/Bear Power indicate overbought and buyer-dominant conditions intraday. Stoch RSI is currently neutral, and the Awesome Oscillator does not confirm the prevailing trend. Oscillator positions point to a risk of a short-term pullback despite the dominance of buyers.
Sideways range likely as breakout probabilities favor upside
In the coming days, CEG is likely to trade in a range between $271.24 and $288.52 based on current volatility. The baseline scenario sees the price consolidating sideways within this projected band. There is a 77% probability of an upward move, and if resistance is broken, further upside toward $288.52 is possible. A drop below $271.24 would put support at the Ichimoku Kijun level in play and could open the way for further weakness.
Earlier, analysts noted that Constellation Energy was showing persistent short- and medium-term technical strength, supported by robust contract coverage and share buybacks, but facing limitations from long-term resistance. With current price action strengthening the positive technical picture and momentum indicators pointing to overbought conditions, traders should monitor the $288.52 resistance for a potential upside breakout or watch for a risk of short-term pullback if support at $271.24 fails.






Latest Constellation Energy News




-
 Afghanistan
-
 Albania
-
 Algeria
-
 Angola
-
 Argentina
-
 Armenia
-
 Australia
-
 Austria
-
 Azerbaijan
-
 Bahamas
-
 Bahrain
-
 Bangladesh
-
 Belarus
-
 Belgium
-
 Bolivia
-
 Botswana
-
 Brazil
-
 Brunei
-
 Bulgaria
-
 Cambodia
-
 Cameroon
-
 Canada
-
 Chile
-
 China
-
 Colombia
-
 Congo
-
 Costa Rica
-
 Cote d'Ivoire
-
 Croatia
-
 Cuba
-
 Cyprus
-
 Czechia
-
 DR Congo
-
 Denmark
-
 Dominican Republic
-
 Ecuador
-
 Egypt
-
 El Salvador
-
 Estonia
-
 Eswatini
-
 Ethiopia
-
 Finland
-
 France
-
 Georgia
-
 Germany
-
 Ghana
-
 Greece
-
 Haiti
-
 Hong Kong
-
 Hungary
-
 India
-
 Indonesia
-
 Iran, Islamic republic
-
 Iraq
-
 Ireland
-
 Israel
-
 Italy
-
 Jamaica
-
 Japan
-
 Jordan
-
 Kazakhstan
-
 Kenya
-
 Korea
-
 Kuwait
-
 Kyrgyzstan
-
 Laos
-
 Latvia
-
 Lebanon
-
 Lesotho
-
 Libya
-
 Lithuania
-
 Luxembourg
-
 Madagascar
-
 Malaysia
-
 Malta
-
 Mauritius
-
 Mexico
-
 Moldova
-
 Mongolia
-
 Montenegro
-
 Morocco
-
 Mozambique
-
 Myanmar
-
 Namibia
-
 Nepal
-
 Netherlands
-
 New Zealand
-
 Nigeria
-
 North Macedonia
-
 Norway
-
 Oman
-
 Pakistan
-
 Palestine
-
 Panama
-
 Papua New Guinea
-
 Paraguay
-
 Peru
-
 Philippines
-
 Poland
-
 Portugal
-
 Puerto Rico
-
 Qatar
-
 Reunion
-
 Romania
-
 Rwanda
-
 Saudi Arabia
-
 Serbia
-
 Singapore
-
 Slovakia
-
 Slovenia
-
 Somalia
-
 South Africa
-
 Spain
-
 Sri Lanka
-
 Sweden
-
 Switzerland
-
 Syria
-
 Taiwan
-
 Tajikistan
-
 Tanzania
-
 Thailand
-
 Trinidad and Tobago
-
 Tunisia
-
 Turkey
-
 UAE
-
 Uganda
-
 Ukraine
-
 United Kingdom
-
United States
-
 Uruguay
-
 Uzbekistan
-
 Venezuela
-
 Vietnam
-
 Yemen
-
 Zambia
-
 Zimbabwe
- Forex
- Crypto












