


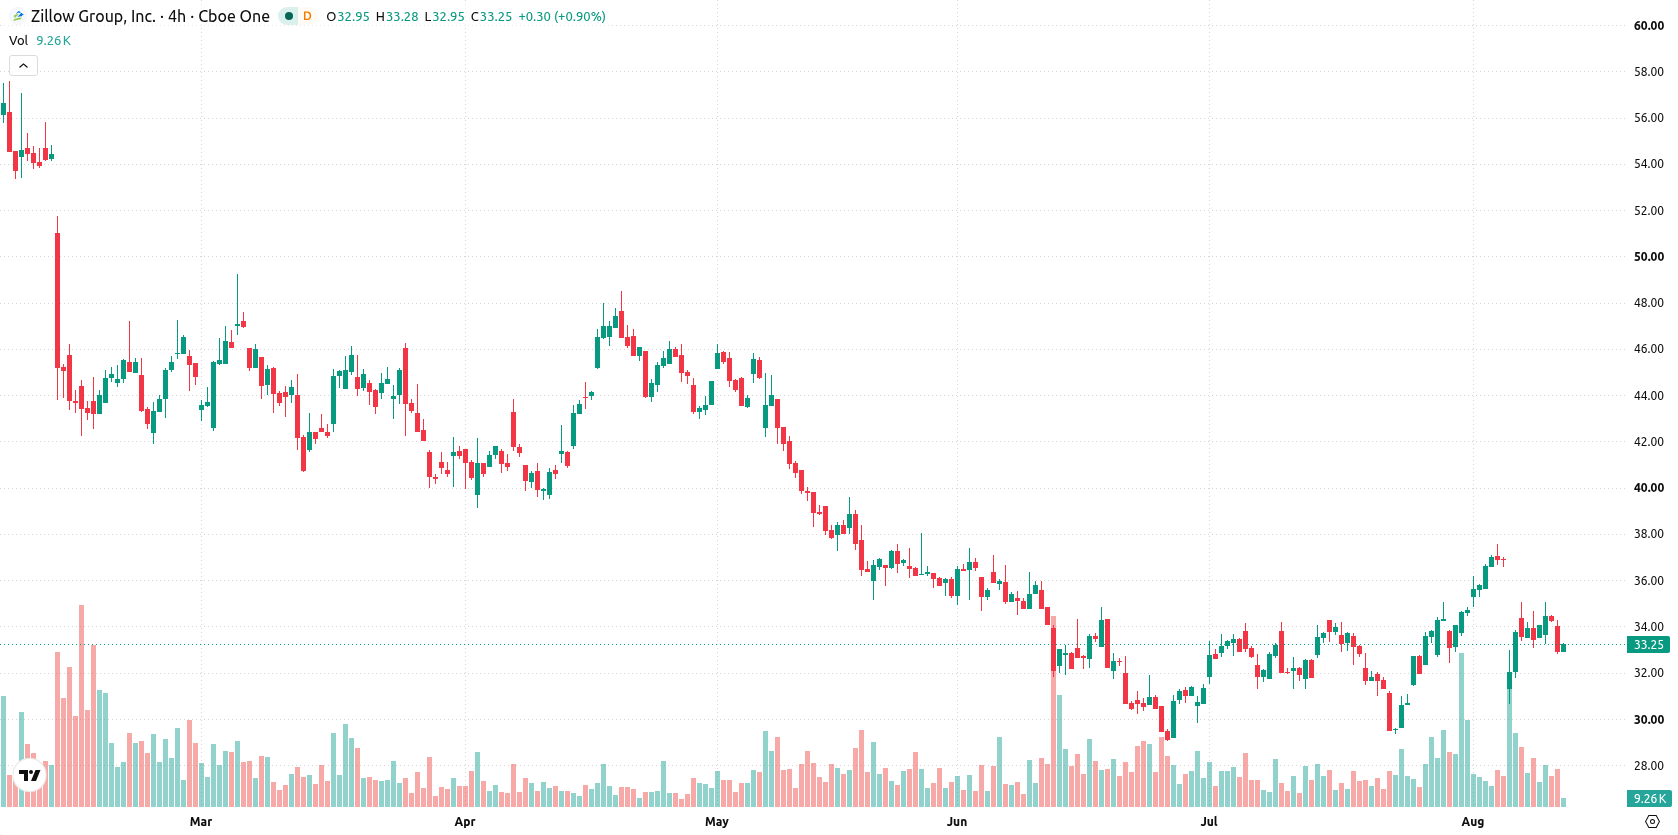
Zillow Group (ZG) dropped 2.95% as near-term selling pressure weighed on the stock, even as strong quarterly results highlighted robust growth in mortgage and rentals revenue. The decline is supported by a long-term bearish technical structure, with shares trading below the 20- and 200-day moving averages and facing nearby resistance.
 33.04
32.52
33.04
32.52
Highlights
- Zillow Group posted Q2 2026 revenue of $772 million, up 18% year over year, with non-GAAP earnings of $0.52 per share.
- Rentals revenue jumped 31%, multifamily rentals rose 42%, and the Zillow Home Loans segment was profitable; the preferred agent partner model now drives 61% of connections with higher revenue per connection.
- Shares of Zillow trade below key moving averages with short-term selling pressure and a forecasted range of $30.99 to $35.52 over the next five sessions.
Investor caution persists despite revenue gains and segment outperformance
Zillow Group reported second quarter 2026 revenue of $772 million, marking an 18% year-over-year increase. Non-GAAP earnings reached $0.52 per share, with growth driven by a 31% increase in rentals revenue, a 42% rise in multifamily rentals, and a profitable Zillow Home Loans segment. The company also noted a transition to a preferred agent partner model, now accounting for 61% of connections and higher revenue per connection, though price action has remained under broader selling pressure.
Mixed momentum emerges as price tests resistance amid weak trend
Zillow is currently trading below its 20-day moving average at $33.61 and well under the 200-day moving average at $49.76, but remains just above the 50-day moving average at $33.21. This setup reflects short-term selling pressure, some stabilization in the medium term, and a bearish bias in the long-term trend as indicated by the MA-50 vs MA-200 alignment. Near-term resistance is at $33.47 (Ichimoku Kijun) and support is at $33.21 (MA-50). Momentum signals are mixed: the Moving Average Convergence Divergence (MACD) signals buy, while the Average Directional Index (ADX) reads neutral, suggesting lackluster trend strength. The Relative Strength Index (RSI) indicates a buy bias and is not overbought, the Stochastic RSI and Commodity Channel Index (CCI) remain neutral, while Bull/Bear Power (BBP) is above zero, showing buyer dominance but already in overbought territory. The daily session sees the stock at $33.26, down $1.01 or 2.95% with a downside gap of about $0.35 (roughly 1.02%), with the price trading near the low of the intraday range and volatility at 4.54%. Intraday action shows renewed downside pressure after the open. Momentum indicators signal a potential rebound, but oscillators suggest caution as buyers test resistance.
Earlier, analysts noted that Zillow’s share price came under significant pressure despite quarterly results that surpassed expectations, as investors focused on longer-term challenges. The current technical setup suggests traders should watch for a breakout above the $33.47 resistance to signal a potential move higher, while a drop below $33.21 may open the way for further downside risk.





Latest Zillow Group News






-
 Afghanistan
-
 Albania
-
 Algeria
-
 Angola
-
 Argentina
-
 Armenia
-
 Australia
-
 Austria
-
 Azerbaijan
-
 Bahamas
-
 Bahrain
-
 Bangladesh
-
 Belarus
-
 Belgium
-
 Bolivia
-
 Botswana
-
 Brazil
-
 Brunei
-
 Bulgaria
-
 Cambodia
-
 Cameroon
-
 Canada
-
 Chile
Chile
-
 China
China
-
 Colombia
-
 Congo
Congo
-
 Costa Rica
-
 Cote d'Ivoire
-
 Croatia
-
 Cuba
Cuba
-
 Cyprus
-
 Czechia
-
 DR Congo
-
 Denmark
-
 Dominican Republic
-
 Ecuador
-
 Egypt
Egypt
-
 El Salvador
-
 Estonia
-
 Eswatini
-
 Ethiopia
-
 Finland
-
 France
-
 Georgia
-
 Germany
-
 Ghana
Ghana
-
 Greece
-
 Haiti
Haiti
-
 Hong Kong
-
 Hungary
-
 India
India
-
 Indonesia
-
 Iran, Islamic republic
-
 Iraq
Iraq
-
 Ireland
-
 Israel
-
 Italy
Italy
-
 Jamaica
-
 Japan
Japan
-
 Jordan
-
 Kazakhstan
-
 Kenya
Kenya
-
 Korea
Korea
-
 Kuwait
-
 Kyrgyzstan
-
 Laos
Laos
-
 Latvia
-
 Lebanon
-
 Lesotho
-
 Libya
Libya
-
 Lithuania
-
 Luxembourg
-
 Madagascar
-
 Malaysia
-
 Malta
Malta
-
 Mauritius
-
 Mexico
-
 Moldova
-
 Mongolia
-
 Montenegro
-
 Morocco
-
 Mozambique
-
 Myanmar
-
 Namibia
-
 Nepal
Nepal
-
 Netherlands
-
 New Zealand
-
 Nigeria
-
 North Macedonia
-
 Norway
-
 Oman
Oman
-
 Pakistan
-
 Palestine
-
 Panama
-
 Papua New Guinea
-
 Paraguay
-
 Peru
Peru
-
 Philippines
-
 Poland
-
 Portugal
-
 Puerto Rico
-
 Qatar
Qatar
-
 Reunion
-
 Romania
-
 Rwanda
-
 Saudi Arabia
-
 Serbia
-
 Singapore
-
 Slovakia
-
 Slovenia
-
 Somalia
-
 South Africa
-
 Spain
Spain
-
 Sri Lanka
-
 Sweden
-
 Switzerland
-
 Syria
Syria
-
 Taiwan
-
 Tajikistan
-
 Tanzania
-
 Thailand
-
 Trinidad and Tobago
-
 Tunisia
-
 Turkey
-
 UAE
UAE
-
 Uganda
-
 Ukraine
-
 United Kingdom
-
United States
-
 Uruguay
-
 Uzbekistan
-
 Venezuela
-
 Vietnam
-
 Yemen
Yemen
-
 Zambia
-
 Zimbabwe
- Forex
- Crypto












