

Why is ServiceNow stock falling today? Key levels to watch as resistance caps upside

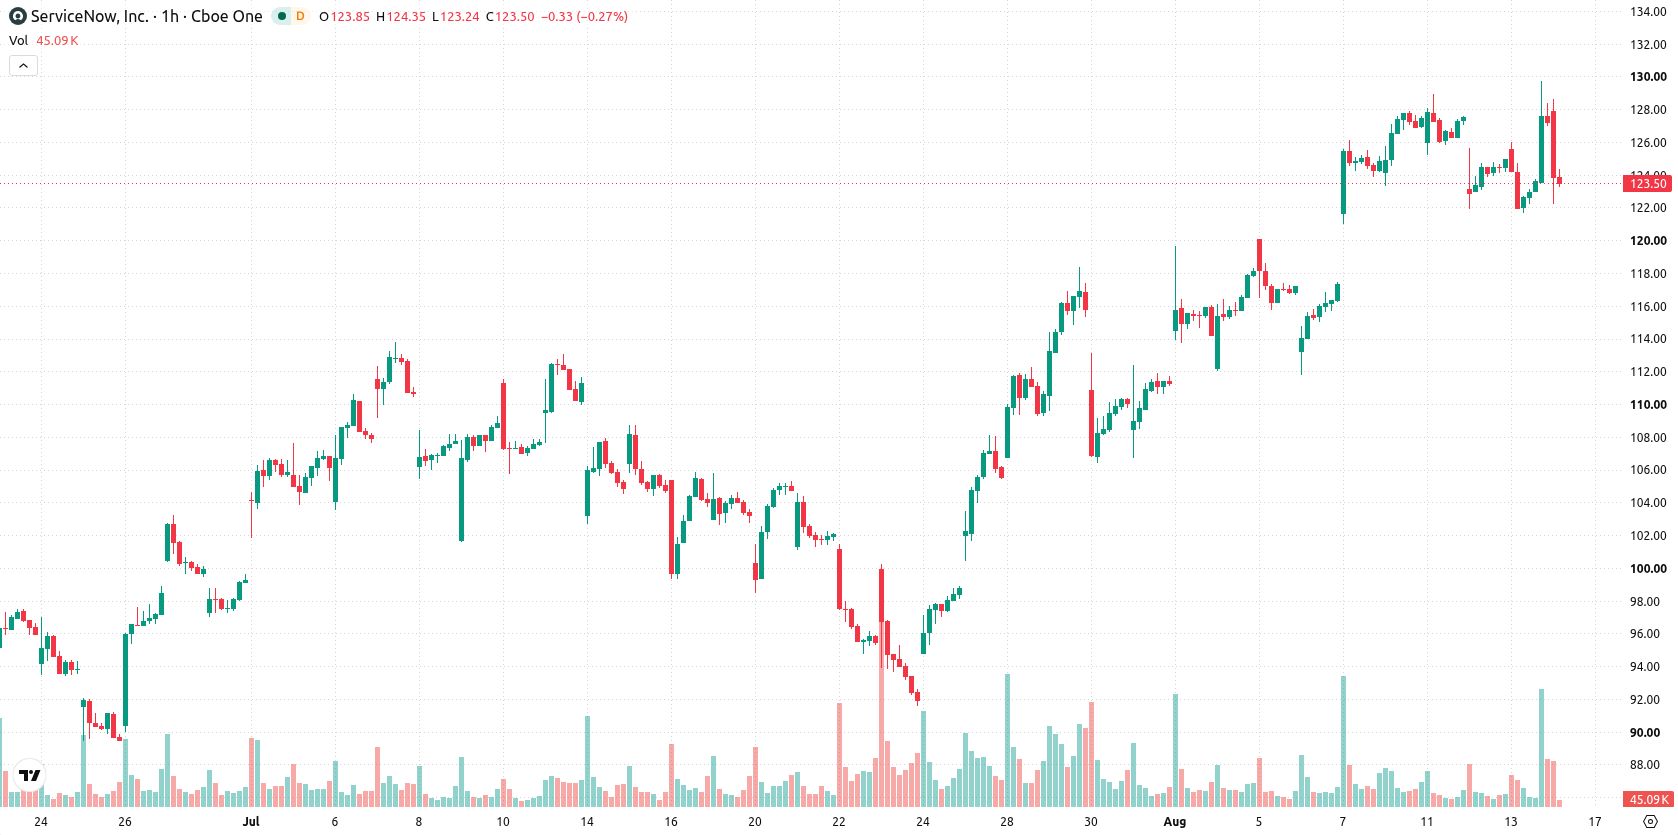
ServiceNow (NOW) stock is trading at $122.92, marking a decline of 3.4% for the day. The current price is positioned below its key short-term moving averages but remains above medium- and long-term trend lines, indicating mixed momentum across timeframes.
 93.10
101.94
Highlights
- ServiceNow generated quarterly revenue of $3.99 billion and a net profit of $298 million for the June quarter.
- The stock faces broad selling pressure despite strong underlying business fundamentals and consistent income generation.
- Shares of ServiceNow fell 3.4% to $122.92 with technical signals showing short-term weakness and an expected range of $119.3 to $134.05.
Valuation under pressure as strong earnings confront market selloff
ServiceNow reported quarterly revenue of $3.99 billion and a net profit of $298 million for the quarter ending June 30, according to Theglobeandmail. These results reflect the company’s established ability to generate significant income, anchoring its business fundamentals. While strong financial performance can provide valuation support, the stock price has remained under broader selling pressure.
Mixed signals as technical boundaries diverge from momentum indicators
NOW is currently trading below its MA-20 level of $124.82, while holding above the MA-50 at $122.88 and the MA-200 at $122.14. The Ichimoku Kijun on the D1 timeframe stands at $125.7, acting as an immediate resistance. MACD signals a Buy, but momentum indicators show conflicting signals: ADX is Neutral, RSI is on Sell, Stochastic RSI points to a Strong Sell, and CCI reads Neutral. Bull/Bear Power is Overbought, indicating recent buyer dominance on an intraday basis, while the Awesome Oscillator is Neutral, lacking direction. Divergence persists as intraday weakness is not fully confirmed by all oscillators, suggesting a mixed technical picture.
Downside risk persists as short-term volatility bands widen
Over the next 2–3 trading days, NOW is expected to fluctuate within a volatility band of $119.3 to $134.05. With the probability of a downward move at 58%, further losses appear more likely in the short term, though a 42% chance for a rebound remains. The baseline scenario anticipates the stock consolidating within this broad range amid persistent volatility. A bullish breakout above $125.7 resistance could trigger further gains, while decisive breaks below $119.3 would increase downside momentum.
Previously it was reported that ServiceNow was experiencing ongoing restructuring alongside mixed technical signals, highlighting a need for vigilance regarding potential downside risk. The latest financial results confirm the company's strong underlying performance, but with short-term technical weakness persisting, traders should closely monitor the $119.3 support level for early signs of further losses.









-
 Afghanistan
-
 Albania
-
 Algeria
-
 Angola
-
 Argentina
-
 Armenia
-
 Australia
-
 Austria
-
 Azerbaijan
-
 Bahamas
-
 Bahrain
-
 Bangladesh
-
 Belarus
-
 Belgium
-
 Bolivia
-
 Botswana
-
 Brazil
-
 Brunei
-
 Bulgaria
-
 Cambodia
-
 Cameroon
-
 Canada
-
 Chile
-
 China
-
 Colombia
-
 Congo
-
 Costa Rica
-
 Cote d'Ivoire
-
 Croatia
-
 Cuba
-
 Cyprus
-
 Czechia
-
 DR Congo
-
 Denmark
-
 Dominican Republic
-
 Ecuador
-
 Egypt
-
 El Salvador
-
 Estonia
-
 Eswatini
-
 Ethiopia
-
 Finland
-
 France
-
 Georgia
-
 Germany
-
 Ghana
-
 Greece
-
 Haiti
-
 Hong Kong
-
 Hungary
-
 India
-
 Indonesia
-
 Iran, Islamic republic
-
 Iraq
-
 Ireland
-
 Israel
-
 Italy
-
 Jamaica
-
 Japan
-
 Jordan
-
 Kazakhstan
-
 Kenya
-
 Korea
-
 Kuwait
-
 Kyrgyzstan
-
 Laos
-
 Latvia
-
 Lebanon
-
 Lesotho
-
 Libya
-
 Lithuania
-
 Luxembourg
-
 Madagascar
-
 Malaysia
-
 Malta
-
 Mauritius
-
 Mexico
-
 Moldova
-
 Mongolia
-
 Montenegro
-
 Morocco
-
 Mozambique
-
 Myanmar
-
 Namibia
-
 Nepal
-
 Netherlands
-
 New Zealand
-
 Nigeria
-
 North Macedonia
-
 Norway
-
 Oman
-
 Pakistan
-
 Palestine
-
 Panama
-
 Papua New Guinea
-
 Paraguay
-
 Peru
-
 Philippines
-
 Poland
-
 Portugal
-
 Puerto Rico
-
 Qatar
-
 Reunion
-
 Romania
-
 Rwanda
-
 Saudi Arabia
-
 Serbia
-
 Singapore
-
 Slovakia
-
 Slovenia
-
 Somalia
-
 South Africa
-
 Spain
-
 Sri Lanka
-
 Sweden
-
 Switzerland
-
 Syria
-
 Taiwan
-
 Tajikistan
-
 Tanzania
-
 Thailand
-
 Trinidad and Tobago
-
 Tunisia
-
 Turkey
-
 UAE
-
 Uganda
-
 Ukraine
-
 United Kingdom
-
United States
-
 Uruguay
-
 Uzbekistan
-
 Venezuela
-
 Vietnam
-
 Yemen
-
 Zambia
-
 Zimbabwe
- Forex
- Crypto












