

TPG stock falls nearly 4% as technical divergence triggers strong intraday selling

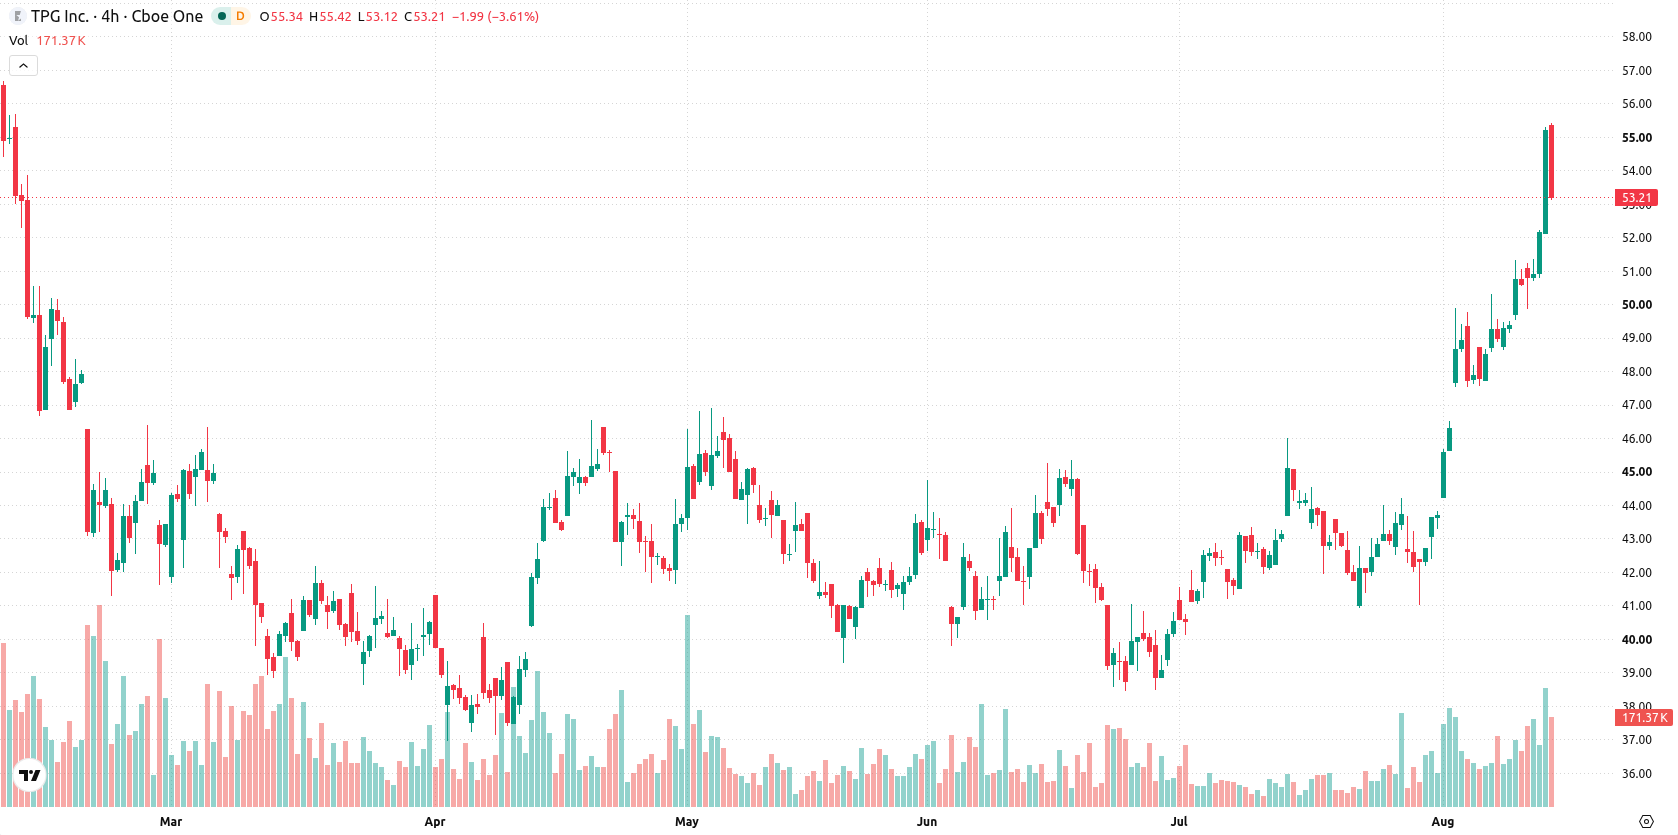
A technical divergence drove a sharp 3.6% drop in TPG Inc (TPG), as intraday selling pressure overwhelmed the recent uptrend momentum. The downside move contradicts ongoing bullish signals, with the asset still trading above key moving averages and strong momentum indicators flashing overbought conditions.
 47.90
45.83
Highlights
- TPG stock is trading above key short, intermediate, and long-term averages, maintaining bullish momentum across multiple timeframes.
- Momentum indicators give a strong buy bias but multiple overbought signals and current weakness point to risk of a short-term pullback.
- Price is expected to remain in a $49.7 to $56.75 range, with upside breakout above $55.3 toward the high or downside below $53.16 toward $49.7.
Mixed momentum as buyers dominate but overbought risks intensify
TPG is trading above its 20-day, 50-day, and 200-day moving averages at $45.91, $43.48, and $49.40 respectively, which underscores ongoing bullish momentum across short, intermediate, and long-term trends. The near-term floor is established at $53.16, with resistance seen at the recent week high of $55.3. The Ichimoku Kijun at $48.09 confirms broader upward structure in the background despite a bearish medium- versus long-term alignment. Momentum indicators reflect a mixed short-term picture: both MACD and Awesome Oscillator signal a buy bias, but the ADX reading of 17.92 points to a neutral trend. Oscillators such as RSI (80.8), CCI (165.77), and Stochastic RSI (100) all show the stock in strongly overbought territory. Bull/Bear Power at 6.67 confirms buyers dominate intraday, but also highlights elevated risk of a short-term pullback. Intraday volatility is high at 4.12%, as TPG opened with a modest upside gap and fell toward the session low. This sets up a notable divergence between early price weakness and broader underlying momentum.
Earlier, analysts noted that TPG was exhibiting strong bullish momentum supported by technical indicators and sustained buyer interest. The recent sharp pullback introduces short-term volatility, making the $53.16 support level crucial for traders monitoring potential swings within the prevailing consolidation range.










-
 Afghanistan
-
 Albania
-
 Algeria
-
 Angola
-
 Argentina
-
 Armenia
-
 Australia
-
 Austria
-
 Azerbaijan
-
 Bahamas
-
 Bahrain
-
 Bangladesh
-
 Belarus
-
 Belgium
-
 Bolivia
-
 Botswana
-
 Brazil
-
 Brunei
-
 Bulgaria
-
 Cambodia
-
 Cameroon
-
 Canada
-
 Chile
-
 China
-
 Colombia
-
 Congo
-
 Costa Rica
-
 Cote d'Ivoire
-
 Croatia
-
 Cuba
-
 Cyprus
-
 Czechia
-
 DR Congo
-
 Denmark
-
 Dominican Republic
-
 Ecuador
-
 Egypt
-
 El Salvador
-
 Estonia
-
 Eswatini
-
 Ethiopia
-
 Finland
-
 France
-
 Georgia
-
 Germany
-
 Ghana
-
 Greece
-
 Haiti
-
 Hong Kong
-
 Hungary
-
 India
-
 Indonesia
-
 Iran, Islamic republic
-
 Iraq
-
 Ireland
-
 Israel
-
 Italy
-
 Jamaica
-
 Japan
-
 Jordan
-
 Kazakhstan
-
 Kenya
-
 Korea
-
 Kuwait
-
 Kyrgyzstan
-
 Laos
-
 Latvia
-
 Lebanon
-
 Lesotho
-
 Libya
-
 Lithuania
-
 Luxembourg
-
 Madagascar
-
 Malaysia
-
 Malta
-
 Mauritius
-
 Mexico
-
 Moldova
-
 Mongolia
-
 Montenegro
-
 Morocco
-
 Mozambique
-
 Myanmar
-
 Namibia
-
 Nepal
-
 Netherlands
-
 New Zealand
-
 Nigeria
-
 North Macedonia
-
 Norway
-
 Oman
-
 Pakistan
-
 Palestine
-
 Panama
-
 Papua New Guinea
-
 Paraguay
-
 Peru
-
 Philippines
-
 Poland
-
 Portugal
-
 Puerto Rico
-
 Qatar
-
 Reunion
-
 Romania
-
 Rwanda
-
 Saudi Arabia
-
 Serbia
-
 Singapore
-
 Slovakia
-
 Slovenia
-
 Somalia
-
 South Africa
-
 Spain
-
 Sri Lanka
-
 Sweden
-
 Switzerland
-
 Syria
-
 Taiwan
-
 Tajikistan
-
 Tanzania
-
 Thailand
-
 Trinidad and Tobago
-
 Tunisia
-
 Turkey
-
 UAE
-
 Uganda
-
 Ukraine
-
 United Kingdom
-
United States
-
 Uruguay
-
 Uzbekistan
-
 Venezuela
-
 Vietnam
-
 Yemen
-
 Zambia
-
 Zimbabwe
- Forex
- Crypto












