

Newmont stock rises over 3% as strong earnings and joint venture settlement drive renewed buying

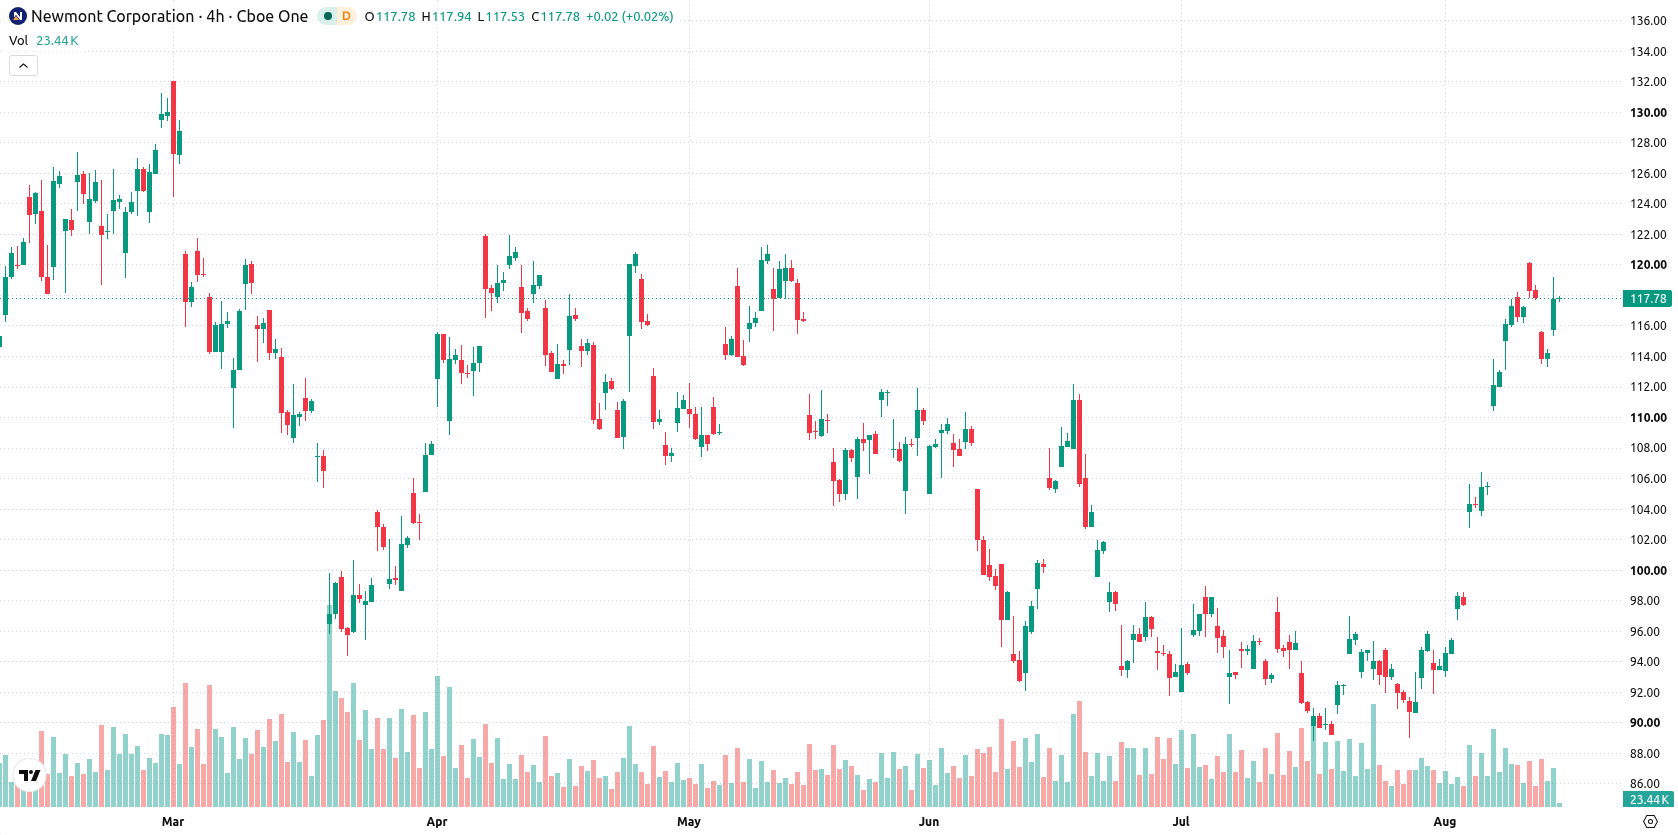
Newmont Corporation (NEM) advanced 3.28% after reporting strong second-quarter earnings and finalizing a major joint venture settlement, drawing renewed buying interest. The up move is further supported by Newmont trading above its 20-day, 50-day, and 200-day moving averages, confirming broad strength across technical timeframes.
 119.16
119.99
Highlights
- Newmont finalized a $1.95 billion cash settlement with Barrick Mining and reorganized the Nevada Gold Mines joint venture in August 2026.
- Adjusted EPS rose 46.9% to $2.10 and revenues climbed 15.1% to $6.12 billion for Q2 2026, with $3.4 billion returned to shareholders and a debt-free position.
- Shares of Newmont trade near session highs with strong buyer dominance, facing support at $115.32 and resistance at $119.02, with a 70% probability of an upward move in the $114.39 to $122.78 range over the next 5 trading days.
Earnings surge and cash windfall as joint venture realignment fuels returns
Newmont finalized a settlement agreement with Barrick Mining in August 2026 regarding their Nevada Gold Mines joint venture, which included a $1.95 billion cash payment and a reorganization of operating frameworks. The company reported a 46.9% year-over-year increase in adjusted EPS to $2.10 for the second quarter of 2026, with revenues rising 15.1% to $6.12 billion. Newmont generated $482.5 million in operating cash flow, maintains a debt-free position, and has $4.3 billion in available capital. Over $3.4 billion has been returned to shareholders through dividends and buybacks, and investment continues in projects like the Red Chris Block Cave and Australian expansions.
Momentum signals diverge as bullish breakout encounters overbought stretch
Newmont is trading above its 20-day, 50-day, and 200-day moving averages ($100.16, $98.89, and $105.08 respectively), indicating strong momentum across short-, medium-, and long-term trends. The nearest support is at $115.32 and resistance is at $119.02, with the Ichimoku Kijun level at $104.59 well below current prices, confirming a prevailing bullish structure. Momentum indicators maintain a positive tilt: the MACD signals a buy, the ADX registers a neutral trend, and the Awesome Oscillator supports continued bullishness. Overbought conditions seen in the RSI, CCI, and BBP reflect sustained buyer dominance, though the Stochastic RSI points to a strong sell, indicating potential divergence. The stock is trading near the day’s high following an upside gap, and intraday volatility stands at 3.21%.
Earlier, analysts noted that Newmont's strong earnings capital returns and progress on key projects supported expectations for further gains, while highlighting the importance of monitoring technical signals for confirmation. The latest developments—particularly the joint venture settlement and robust second-quarter results—reinforce the bullish technical structure, with traders advised to monitor for a sustained breakout above $119.02 as a potential catalyst for renewed upside.





Latest Newmont Corporation News





-
 Afghanistan
-
 Albania
-
 Algeria
-
 Angola
-
 Argentina
-
 Armenia
-
 Australia
-
 Austria
-
 Azerbaijan
-
 Bahamas
-
 Bahrain
-
 Bangladesh
-
 Belarus
-
 Belgium
-
 Bolivia
-
 Botswana
-
 Brazil
-
 Brunei
-
 Bulgaria
-
 Cambodia
-
 Cameroon
-
 Canada
-
 Chile
-
 China
-
 Colombia
-
 Congo
-
 Costa Rica
-
 Cote d'Ivoire
-
 Croatia
-
 Cuba
-
 Cyprus
-
 Czechia
-
 DR Congo
-
 Denmark
-
 Dominican Republic
-
 Ecuador
-
 Egypt
-
 El Salvador
-
 Estonia
-
 Eswatini
-
 Ethiopia
-
 Finland
-
 France
-
 Georgia
-
 Germany
-
 Ghana
-
 Greece
-
 Haiti
-
 Hong Kong
-
 Hungary
-
 India
-
 Indonesia
-
 Iran, Islamic republic
-
 Iraq
-
 Ireland
-
 Israel
-
 Italy
-
 Jamaica
-
 Japan
-
 Jordan
-
 Kazakhstan
-
 Kenya
-
 Korea
-
 Kuwait
-
 Kyrgyzstan
-
 Laos
-
 Latvia
-
 Lebanon
-
 Lesotho
-
 Libya
-
 Lithuania
-
 Luxembourg
-
 Madagascar
-
 Malaysia
-
 Malta
-
 Mauritius
-
 Mexico
-
 Moldova
-
 Mongolia
-
 Montenegro
-
 Morocco
-
 Mozambique
-
 Myanmar
-
 Namibia
-
 Nepal
-
 Netherlands
-
 New Zealand
-
 Nigeria
-
 North Macedonia
-
 Norway
-
 Oman
-
 Pakistan
-
 Palestine
-
 Panama
-
 Papua New Guinea
-
 Paraguay
-
 Peru
-
 Philippines
-
 Poland
-
 Portugal
-
 Puerto Rico
-
 Qatar
-
 Reunion
-
 Romania
-
 Rwanda
-
 Saudi Arabia
-
 Serbia
-
 Singapore
-
 Slovakia
-
 Slovenia
-
 Somalia
-
 South Africa
-
 Spain
-
 Sri Lanka
-
 Sweden
-
 Switzerland
-
 Syria
-
 Taiwan
-
 Tajikistan
-
 Tanzania
-
 Thailand
-
 Trinidad and Tobago
-
 Tunisia
-
 Turkey
-
 UAE
-
 Uganda
-
 Ukraine
-
 United Kingdom
-
United States
-
 Uruguay
-
 Uzbekistan
-
 Venezuela
-
 Vietnam
-
 Yemen
-
 Zambia
-
 Zimbabwe
- Forex
- Crypto












