

What's behind ON Semiconductor's latest 5.2% stock pullback?

ON Semiconductor Corporation (ON) dropped 5.17% as intensifying technical selling pressure drove a sharp decline. The move is supported by the stock trading below its short- and medium-term moving averages, signaling persistent bearish momentum.
 74.95
77.24
74.95
77.24
Highlights
- Shares of ON Semiconductor are under strong short- and medium-term bearish pressure, trading below their 20-day and 50-day moving averages.
- Most momentum indicators are negative and align with the current intraday decline of 5.17 percent, although some show intraday readings as overbought.
- The expected price range for the next five sessions is $76.98 to $83.87, with a 63 percent probability of further downside.
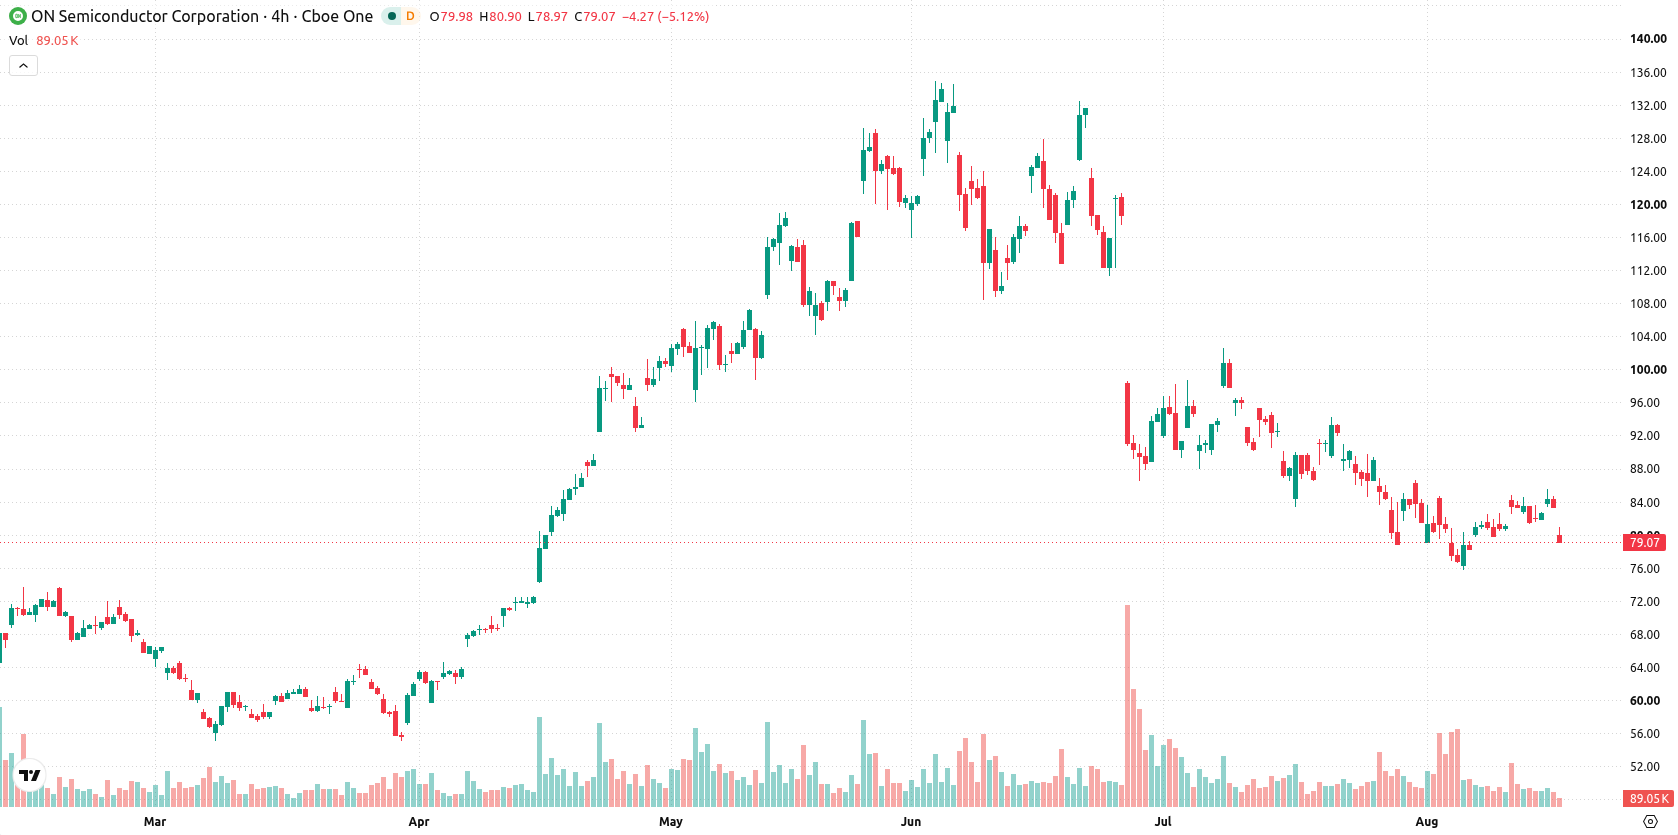
Short-term selling pressure as long-term bullish structure persists
ON is trading below its 20-day and 50-day moving averages at $83.37 and $95.98, but remains above the 200-day average at $76.59. This points to short- and medium-term bearish pressure, though the long-term trend holds a bullish structure. Immediate resistance is seen at $81.3 and support at $76.98. Momentum indicators are mostly negative: the MACD shows strong selling, ADX indicates ongoing sell pressure, and both RSI (45.77) and CCI (8.24) are near neutral. The Stochastic RSI is highly overbought at 100, and BBP flags intraday buyer dominance, but both are considered overbought. The Awesome Oscillator remains neutral and does not confirm the downward bias. ON fell $4.31 intraday following a small upside gap and remains near the day's low, with intraday volatility at 2.53%, underlining heavy pressure after the open.
In a recent review, ON Semiconductor was noted to be experiencing technical weakness despite previously strong operational results, with bearish momentum prevailing in the short and medium term. The latest selloff reinforces this trend, making $76.98 a key level to watch for further downside risk in the near term.





Latest ON Semiconductor Corporation News



-
 Afghanistan
-
 Albania
-
 Algeria
-
 Angola
-
 Argentina
-
 Armenia
-
 Australia
-
 Austria
-
 Azerbaijan
-
 Bahamas
-
 Bahrain
-
 Bangladesh
-
 Belarus
-
 Belgium
-
 Bolivia
-
 Botswana
-
 Brazil
-
 Brunei
-
 Bulgaria
-
 Cambodia
-
 Cameroon
-
 Canada
-
 Chile
Chile
-
 China
China
-
 Colombia
-
 Congo
Congo
-
 Costa Rica
-
 Cote d'Ivoire
-
 Croatia
-
 Cuba
Cuba
-
 Cyprus
-
 Czechia
-
 DR Congo
-
 Denmark
-
 Dominican Republic
-
 Ecuador
-
 Egypt
Egypt
-
 El Salvador
-
 Estonia
-
 Eswatini
-
 Ethiopia
-
 Finland
-
 France
-
 Georgia
-
 Germany
-
 Ghana
Ghana
-
 Greece
-
 Haiti
Haiti
-
 Hong Kong
-
 Hungary
-
 India
India
-
 Indonesia
-
 Iran, Islamic republic
-
 Iraq
Iraq
-
 Ireland
-
 Israel
-
 Italy
Italy
-
 Jamaica
-
 Japan
Japan
-
 Jordan
-
 Kazakhstan
-
 Kenya
Kenya
-
 Korea
Korea
-
 Kuwait
-
 Kyrgyzstan
-
 Laos
Laos
-
 Latvia
-
 Lebanon
-
 Lesotho
-
 Libya
Libya
-
 Lithuania
-
 Luxembourg
-
 Madagascar
-
 Malaysia
-
 Malta
Malta
-
 Mauritius
-
 Mexico
-
 Moldova
-
 Mongolia
-
 Montenegro
-
 Morocco
-
 Mozambique
-
 Myanmar
-
 Namibia
-
 Nepal
Nepal
-
 Netherlands
-
 New Zealand
-
 Nigeria
-
 North Macedonia
-
 Norway
-
 Oman
Oman
-
 Pakistan
-
 Palestine
-
 Panama
-
 Papua New Guinea
-
 Paraguay
-
 Peru
Peru
-
 Philippines
-
 Poland
-
 Portugal
-
 Puerto Rico
-
 Qatar
Qatar
-
 Reunion
-
 Romania
-
 Rwanda
-
 Saudi Arabia
-
 Serbia
-
 Singapore
-
 Slovakia
-
 Slovenia
-
 Somalia
-
 South Africa
-
 Spain
Spain
-
 Sri Lanka
-
 Sweden
-
 Switzerland
-
 Syria
Syria
-
 Taiwan
-
 Tajikistan
-
 Tanzania
-
 Thailand
-
 Trinidad and Tobago
-
 Tunisia
-
 Turkey
-
 UAE
UAE
-
 Uganda
-
 Ukraine
-
 United Kingdom
-
United States
-
 Uruguay
-
 Uzbekistan
-
 Venezuela
-
 Vietnam
-
 Yemen
Yemen
-
 Zambia
-
 Zimbabwe
- Forex
- Crypto












