

Costco stock remains steady as price hovers just above key support: weekly analysis

Shares of Costco Wholesale Corporation (COST) are trading near $961, with the chart reflecting a tight, uncertain range as buyers continue to hold control. Conflicting technical signals and consolidation near resistance suggest momentum is still in flux — keeping the focus on how the setup resolves in the days ahead.
 1021.31
Highlights
- Shares of Costco closed at $961.45 after a narrow gain over the past seven days, remaining above all major daily moving averages.
- Price action shows the stock consolidating near the top of the recent weekly band with mixed momentum indicators and neutral positioning.
- The next five trading days are expected to see the stock range from $944.65 to $974.31, with a slightly higher probability of a decrease and key support at $958.63 and resistance at $963.81.
Diversification moves and record sales bolster sentiment during the week
Costco announced a major diversification on August 18, 2026, partnering with SCAN Group to launch its own line of Medicare Advantage and supplemental insurance plans in select U.S. states, according to GuruFocus. Recent four-week net sales totaled $23.12 billion with year-to-date figures reaching $273.55 billion, as reported by Simply Wall St, while third-quarter membership fee revenues rose 10.7% year-over-year to $1.373 billion, according to TradingView News. The company has also introduced new wellness-focused products and continued rolling out goods and services, reinforcing its retail strength amid ongoing international expansion and steady dividend growth noted by The Motley Fool and Yahoo Finance.
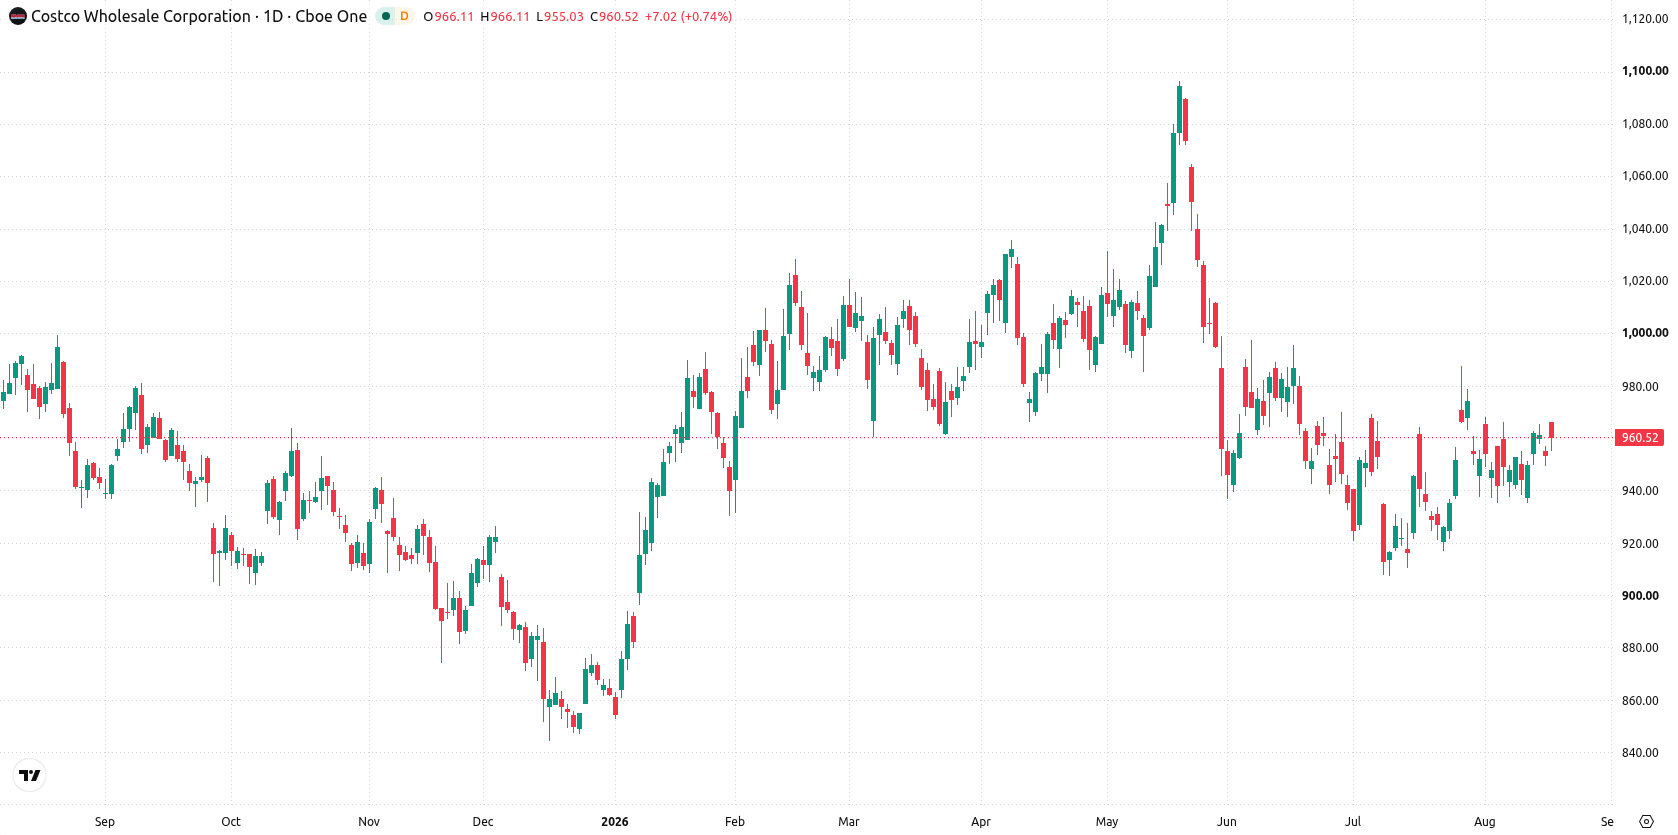
Mixed technical indicators as consolidation persists near weekly highs
On the daily chart, Costco stock is exhibiting a contained move within a narrow range, with price action consolidating near the top of the recent weekly band. Momentum signals paint a mixed picture: MACD remains in buy mode at 2.98, while HMA forecasts a sell and Bull/Bear Power registers as overbought. With volatility at 3.08% and the RSI holding a neutral zone at 51.59, immediate direction is uncertain. Price is sitting just above support at $958.63 (MA-200) and testing resistance at $963.81, with the Ichimoku Kijun at $949.03 acting as additional support.
Breakout risk elevated as narrow consolidation defines next week’s outlook
For the next five trading days, the expected range is $944.65 to $974.31. There is a 47% probability of an increase and a 53% probability of a decrease. The base case favors continued consolidation between $958.63 and $963.81. A break above $963.81 could open the door for a move toward $974.31, while a drop below $958.63 would shift the focus toward the lower boundary at $944.65.
Earlier, analysts noted that Costco shares were consolidating as technical indicators signaled a lack of clear directional momentum. The current setup adds the dimension of business diversification and ongoing international expansion, making the $958.63 support and $963.81 resistance levels pivotal for gauging the next significant move.











-
 Afghanistan
-
 Albania
-
 Algeria
-
 Angola
-
 Argentina
-
 Armenia
-
 Australia
-
 Austria
-
 Azerbaijan
-
 Bahamas
-
 Bahrain
-
 Bangladesh
-
 Belarus
-
 Belgium
-
 Bolivia
-
 Botswana
-
 Brazil
-
 Brunei
-
 Bulgaria
-
 Cambodia
-
 Cameroon
-
 Canada
-
 Chile
-
 China
-
 Colombia
-
 Congo
-
 Costa Rica
-
 Cote d'Ivoire
-
 Croatia
-
 Cuba
-
 Cyprus
-
 Czechia
-
 DR Congo
-
 Denmark
-
 Dominican Republic
-
 Ecuador
-
 Egypt
-
 El Salvador
-
 Estonia
-
 Eswatini
-
 Ethiopia
-
 Finland
-
 France
-
 Georgia
-
 Germany
-
 Ghana
-
 Greece
-
 Haiti
-
 Hong Kong
-
 Hungary
-
 India
-
 Indonesia
-
 Iran, Islamic republic
-
 Iraq
-
 Ireland
-
 Israel
-
 Italy
-
 Jamaica
-
 Japan
-
 Jordan
-
 Kazakhstan
-
 Kenya
-
 Korea
-
 Kuwait
-
 Kyrgyzstan
-
 Laos
-
 Latvia
-
 Lebanon
-
 Lesotho
-
 Libya
-
 Lithuania
-
 Luxembourg
-
 Madagascar
-
 Malaysia
-
 Malta
-
 Mauritius
-
 Mexico
-
 Moldova
-
 Mongolia
-
 Montenegro
-
 Morocco
-
 Mozambique
-
 Myanmar
-
 Namibia
-
 Nepal
-
 Netherlands
-
 New Zealand
-
 Nigeria
-
 North Macedonia
-
 Norway
-
 Oman
-
 Pakistan
-
 Palestine
-
 Panama
-
 Papua New Guinea
-
 Paraguay
-
 Peru
-
 Philippines
-
 Poland
-
 Portugal
-
 Puerto Rico
-
 Qatar
-
 Reunion
-
 Romania
-
 Rwanda
-
 Saudi Arabia
-
 Serbia
-
 Singapore
-
 Slovakia
-
 Slovenia
-
 Somalia
-
 South Africa
-
 Spain
-
 Sri Lanka
-
 Sweden
-
 Switzerland
-
 Syria
-
 Taiwan
-
 Tajikistan
-
 Tanzania
-
 Thailand
-
 Trinidad and Tobago
-
 Tunisia
-
 Turkey
-
 UAE
-
 Uganda
-
 Ukraine
-
 United Kingdom
-
United States
-
 Uruguay
-
 Uzbekistan
-
 Venezuela
-
 Vietnam
-
 Yemen
-
 Zambia
-
 Zimbabwe
- Forex
- Crypto












