


Dutch Bros Inc (BROS) rebounded 3.92% as oversold signals and intraday volatility sparked short-term buying interest. The recovery looks limited, with the stock still trading below all key moving averages and a dominant sell bias in technical indicators.
 35.69
37.45
Highlights
- Shares of Dutch Bros trade below all major moving averages, indicating sustained downward pressure across timeframes.
- Technical indicators including MACD, ADX, RSI, Stochastic RSI, and CCI all register negative or oversold signals, confirming prevailing weakness.
- The projected five-day price range is $47.3 to $52.53 with over 80% probability for a downward move in a predominantly sideways trading setup.
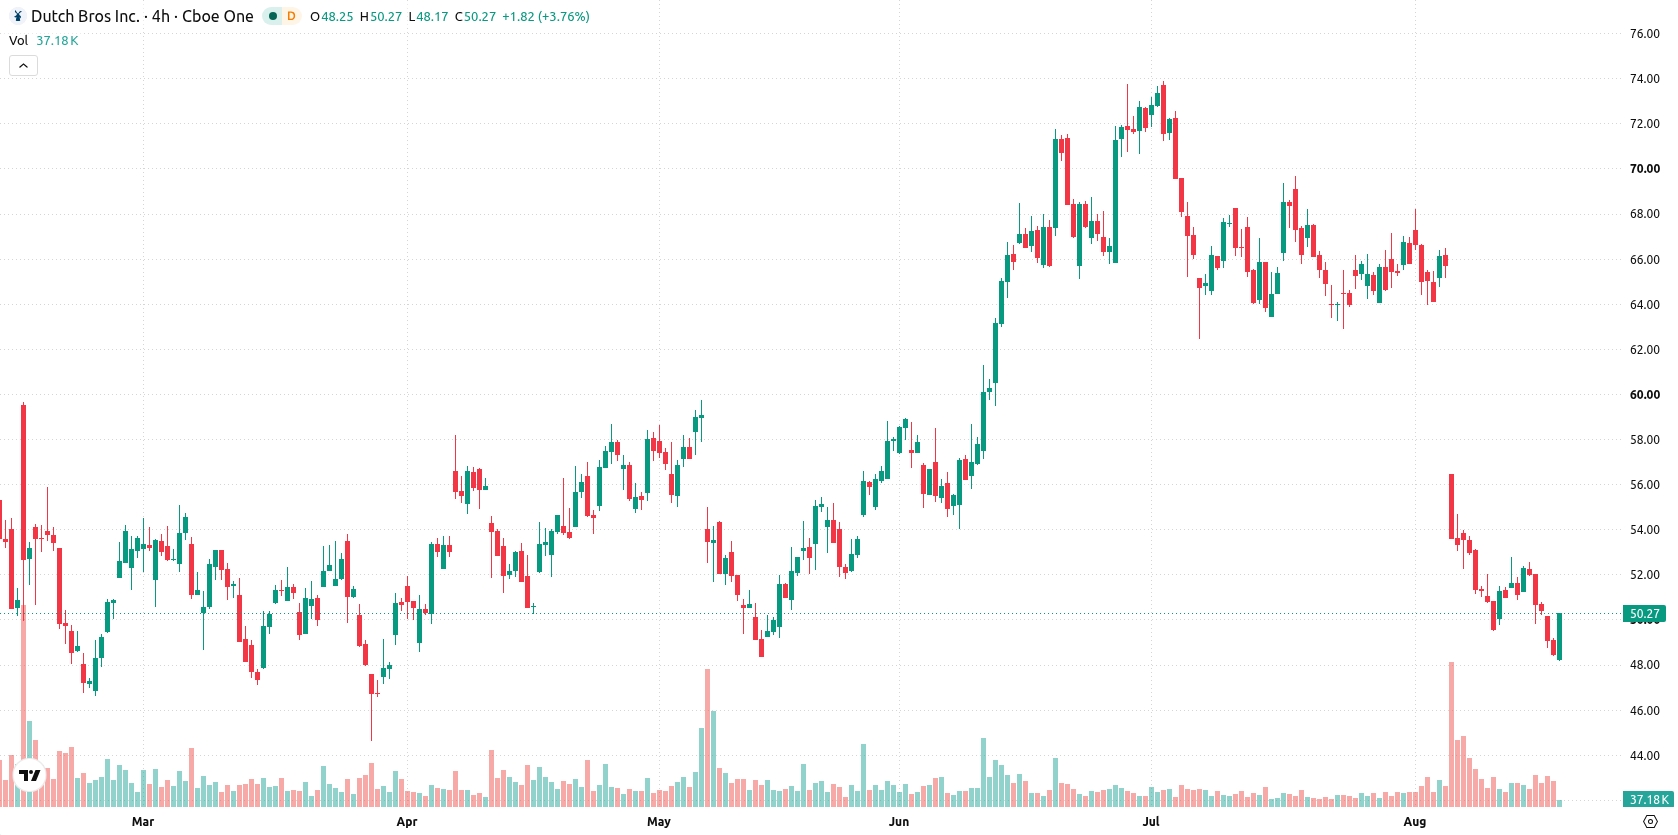
Persistent seller control as price diverges from oversold technicals
Dutch Bros is trading below all key moving averages, with the latest price at $50.34 under the MA-20 at $58.71, MA-50 at $63.41, and MA-200 at $57.56. This structure demonstrates sustained seller pressure over short, medium, and long-term horizons. The near-term ceiling is set at $52.53 and support at $49.22. Both the MACD and ADX indicate an ongoing sell signal, confirming continued technical weakness. Oversold readings are flagged by the RSI, Stochastic RSI, and CCI, while a Bull/Bear Power (BBP) of -4.43 highlights intraday momentum skewed toward sellers and continued oversold risk. Intraday volatility stands at 2.26%, and although the price has rallied $1.90 or 3.92% today, this intraday rebound is not reflected in underlying momentum indicators, signaling a divergence between temporary price strength and the prevailing technical trend.
Earlier, analysts noted that Dutch Bros was under sustained technical pressure with sellers dominating the price action. The current analysis reinforces this bearish outlook, advising traders to closely monitor the $49.22 support as a breach could trigger further downside toward $47.3.






Latest Dutch Bros News




-
 Afghanistan
-
 Albania
-
 Algeria
-
 Angola
-
 Argentina
-
 Armenia
-
 Australia
-
 Austria
-
 Azerbaijan
-
 Bahamas
-
 Bahrain
-
 Bangladesh
-
 Belarus
-
 Belgium
-
 Bolivia
-
 Botswana
-
 Brazil
-
 Brunei
-
 Bulgaria
-
 Cambodia
-
 Cameroon
-
 Canada
-
 Chile
-
 China
-
 Colombia
-
 Congo
-
 Costa Rica
-
 Cote d'Ivoire
-
 Croatia
-
 Cuba
-
 Cyprus
-
 Czechia
-
 DR Congo
-
 Denmark
-
 Dominican Republic
-
 Ecuador
-
 Egypt
-
 El Salvador
-
 Estonia
-
 Eswatini
-
 Ethiopia
-
 Finland
-
 France
-
 Georgia
-
 Germany
-
 Ghana
-
 Greece
-
 Haiti
-
 Hong Kong
-
 Hungary
-
 India
-
 Indonesia
-
 Iran, Islamic republic
-
 Iraq
-
 Ireland
-
 Israel
-
 Italy
-
 Jamaica
-
 Japan
-
 Jordan
-
 Kazakhstan
-
 Kenya
-
 Korea
-
 Kuwait
-
 Kyrgyzstan
-
 Laos
-
 Latvia
-
 Lebanon
-
 Lesotho
-
 Libya
-
 Lithuania
-
 Luxembourg
-
 Madagascar
-
 Malaysia
-
 Malta
-
 Mauritius
-
 Mexico
-
 Moldova
-
 Mongolia
-
 Montenegro
-
 Morocco
-
 Mozambique
-
 Myanmar
-
 Namibia
-
 Nepal
-
 Netherlands
-
 New Zealand
-
 Nigeria
-
 North Macedonia
-
 Norway
-
 Oman
-
 Pakistan
-
 Palestine
-
 Panama
-
 Papua New Guinea
-
 Paraguay
-
 Peru
-
 Philippines
-
 Poland
-
 Portugal
-
 Puerto Rico
-
 Qatar
-
 Reunion
-
 Romania
-
 Rwanda
-
 Saudi Arabia
-
 Serbia
-
 Singapore
-
 Slovakia
-
 Slovenia
-
 Somalia
-
 South Africa
-
 Spain
-
 Sri Lanka
-
 Sweden
-
 Switzerland
-
 Syria
-
 Taiwan
-
 Tajikistan
-
 Tanzania
-
 Thailand
-
 Trinidad and Tobago
-
 Tunisia
-
 Turkey
-
 UAE
-
 Uganda
-
 Ukraine
-
 United Kingdom
-
United States
-
 Uruguay
-
 Uzbekistan
-
 Venezuela
-
 Vietnam
-
 Yemen
-
 Zambia
-
 Zimbabwe
- Forex
- Crypto












