

Capital expenditure rises nearly 80%: Can MSFT avoid deeper losses?

Microsoft (MSFT) stock is trading at $481.68 after a modest day, posting a slight intraday gain and holding mid-range for the session. The price currently sits below its short- and medium-term moving averages, while remaining above longer-term daily support levels.
 530.94
535.00
Highlights
- Microsoft reported annual Azure cloud revenue above $100 billion and 43% year-over-year Azure growth, confirming strong enterprise demand for its cloud and AI products.
- Quarterly results included 30 million paid Microsoft 365 Copilot seats and $54.9 billion in total cloud revenue, with capital expenditure for 2026 projected at $115.95 billion.
- Shares of Microsoft show prevailing short- and medium-term selling pressure with a 74% probability of trading between $471.35 to $492.01 over the next 2 to 3 days.
Cloud revenue milestone as AI expansion raises cash flow risks
Microsoft surpassed $100 billion in annual Azure cloud revenue for the first time, confirming its position at the forefront of enterprise cloud adoption and AI-driven services, according to Foreignpolicyjournal. This achievement, supported by quarterly results featuring 30 million paid Microsoft 365 Copilot seats and Q4 revenue reaching $90 billion, demonstrates tangible demand for its infrastructure and AI products, as highlighted by Finance Yahoo. Persistent year-over-year growth in Azure of 43% and total cloud revenue of $54.9 billion further establish the company's operational momentum, though the near 80% rise in capital expenditure to $115.95 billion for fiscal year 2026 introduces concerns about future free cash flow and profitability dynamics.
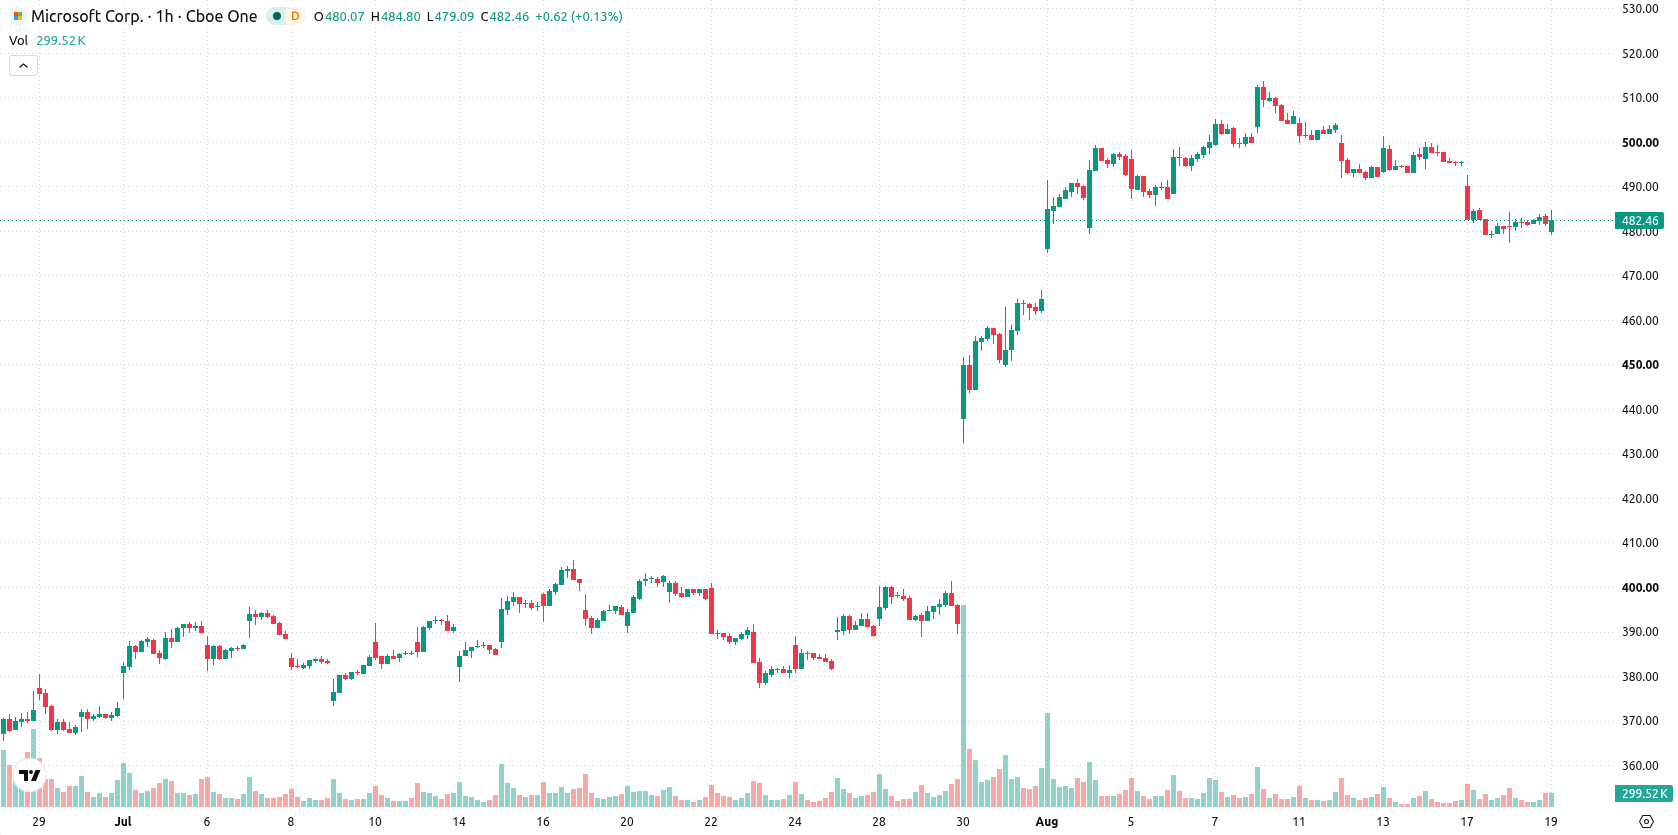
Downward momentum persists as short-term resistance holds
On the technical front, MSFT is trading below the MA-20 and MA-50 on the hourly chart, while still staying above the MA-200 on the daily timeframe. The Ichimoku Kijun is currently at $488.58, serving as immediate resistance. Momentum indicators are broadly negative: RSI is at 35.92 (Sell), MACD signals Strong Sell, and the ADX corroborates a continued selling bias. Both Stochastic RSI and CCI show neutral readings, Bull/Bear Power flags an oversold intraday condition favoring sellers, and the Awesome Oscillator is neutral, offering no fresh confirmation for the downside.
Downside probability rises as range-bound action dominates outlook
In the near term, MSFT is expected to fluctuate within a range of $471.35 to $492.01, reflecting typical volatility relative to current levels. Probability models suggest a higher likelihood for downside movement, with a 74% chance of a downturn and only 26% probability of an upside move in the next 2-3 trading days. The base scenario calls for consolidation between these boundaries; however, a breakthrough above $488.58 could see a push towards upper resistance, while a move below $471.35 would add to downside risk.
Earlier, analysts noted that market leadership was broadening beyond mega-cap technology stocks, with strength appearing across a wider range of sectors and smaller market-cap names. In the case of Microsoft, the current technical setup signals heightened downside risk in the near term, making the $471.35 support level a critical threshold for traders to monitor.






Latest Microsoft News





-
 Afghanistan
-
 Albania
-
 Algeria
-
 Angola
-
 Argentina
-
 Armenia
-
 Australia
-
 Austria
-
 Azerbaijan
-
 Bahamas
-
 Bahrain
-
 Bangladesh
-
 Belarus
-
 Belgium
-
 Bolivia
-
 Botswana
-
 Brazil
-
 Brunei
-
 Bulgaria
-
 Cambodia
-
 Cameroon
-
 Canada
-
 Chile
-
 China
-
 Colombia
-
 Congo
-
 Costa Rica
-
 Cote d'Ivoire
-
 Croatia
-
 Cuba
-
 Cyprus
-
 Czechia
-
 DR Congo
-
 Denmark
-
 Dominican Republic
-
 Ecuador
-
 Egypt
-
 El Salvador
-
 Estonia
-
 Eswatini
-
 Ethiopia
-
 Finland
-
 France
-
 Georgia
-
 Germany
-
 Ghana
-
 Greece
-
 Haiti
-
 Hong Kong
-
 Hungary
-
 India
-
 Indonesia
-
 Iran, Islamic republic
-
 Iraq
-
 Ireland
-
 Israel
-
 Italy
-
 Jamaica
-
 Japan
-
 Jordan
-
 Kazakhstan
-
 Kenya
-
 Korea
-
 Kuwait
-
 Kyrgyzstan
-
 Laos
-
 Latvia
-
 Lebanon
-
 Lesotho
-
 Libya
-
 Lithuania
-
 Luxembourg
-
 Madagascar
-
 Malaysia
-
 Malta
-
 Mauritius
-
 Mexico
-
 Moldova
-
 Mongolia
-
 Montenegro
-
 Morocco
-
 Mozambique
-
 Myanmar
-
 Namibia
-
 Nepal
-
 Netherlands
-
 New Zealand
-
 Nigeria
-
 North Macedonia
-
 Norway
-
 Oman
-
 Pakistan
-
 Palestine
-
 Panama
-
 Papua New Guinea
-
 Paraguay
-
 Peru
-
 Philippines
-
 Poland
-
 Portugal
-
 Puerto Rico
-
 Qatar
-
 Reunion
-
 Romania
-
 Rwanda
-
 Saudi Arabia
-
 Serbia
-
 Singapore
-
 Slovakia
-
 Slovenia
-
 Somalia
-
 South Africa
-
 Spain
-
 Sri Lanka
-
 Sweden
-
 Switzerland
-
 Syria
-
 Taiwan
-
 Tajikistan
-
 Tanzania
-
 Thailand
-
 Trinidad and Tobago
-
 Tunisia
-
 Turkey
-
 UAE
-
 Uganda
-
 Ukraine
-
 United Kingdom
-
United States
-
 Uruguay
-
 Uzbekistan
-
 Venezuela
-
 Vietnam
-
 Yemen
-
 Zambia
-
 Zimbabwe
- Forex
- Crypto












