

Palantir shares technical analysis: Consolidation near $175.41 resistance

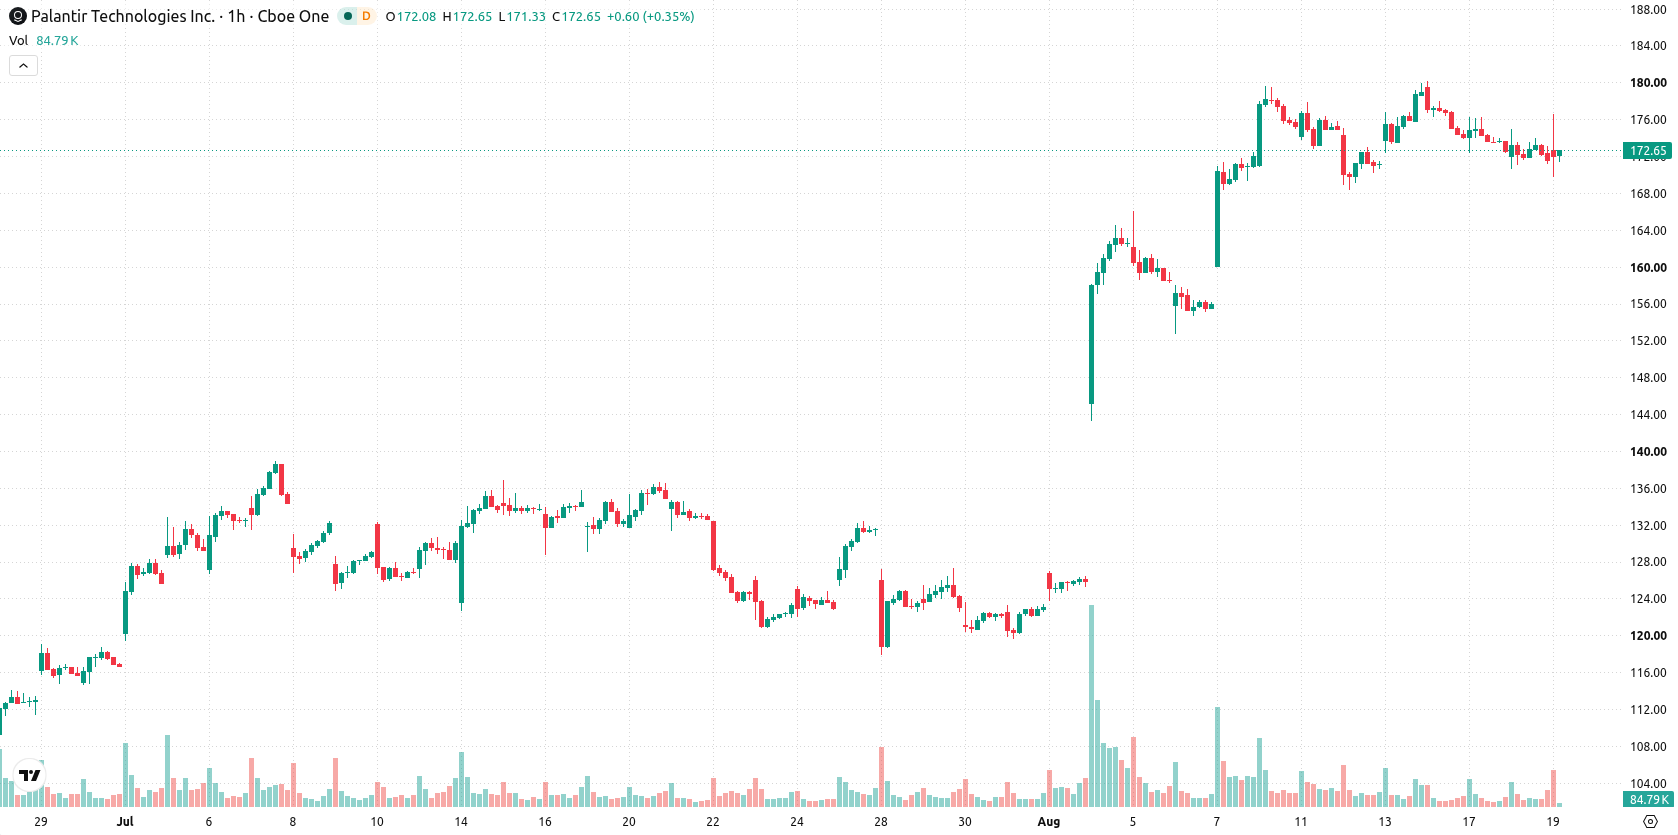
Palantir (PLTR) stock is trading at $171.63 after a modest gain in today’s session, with price movement remaining within a narrow range. The stock currently sits below its short- and medium-term moving averages, while still holding above key long-term support.
 193.92
201.68
Highlights
- Palantir Technologies has completed its second Sovereignty Bootcamp, drawing nearly 200 enterprises including Dell and HCA Healthcare.
- This outreach represents a shift to grow Palantir’s enterprise AI business beyond its traditional government client base, with new relationships expected to develop over time.
- Shares of Palantir are trading between $167.69 and $175.57, with weak momentum and oversold technical signals indicating short-term downside is more likely.
Broadened enterprise push as bootcamps target corporate adoption
Palantir Technologies has recently completed its second Sovereignty Bootcamp, which brought together nearly 100 organizations, following on from the inaugural event held July 27. According to Investing.com, these bootcamps collectively attracted almost 200 unique enterprises, including major names such as Dell and HCA Healthcare, highlighting a concerted push to expand Palantir’s enterprise AI presence well beyond its traditional focus on government clients. This concentrated outreach signals a strategic effort to broaden market demand for Palantir’s offerings and could gradually build new institutional relationships, though the effect is expected to play out over time.
Bearish momentum as price tests oversold technical levels
On the hourly chart, PLTR has slipped below its MA-20 at $173.95 and MA-50 at $174.51, while remaining securely above its long-term MA-200 at $151.85. The Ichimoku Kijun at $175.41 serves as immediate resistance, with short-term support now identified at $167.69. Momentum indicators remain weak: MACD signals a sell, ADX is neutral, and the Awesome Oscillator shows no clear bias. Meanwhile, RSI, Stoch RSI, CCI, and Bull/Bear Power all register oversold readings, confirming that sellers dominated the recent action and signaling potential exhaustion among sellers.
Downside risk prevails as volatility bands contain price
Over the coming days, PLTR is expected to fluctuate between $167.69 and $175.57, reflecting a volatility band relative to current levels. Current model probabilities favor a marginal tilt toward further downside, with a 52% chance for a move lower versus a 48% up probability. The baseline scenario calls for continued sideways trading within the established range. A sustained close above resistance at $175.41 could pave the way for further upside, while a drop below $167.69 would risk triggering accelerated declines.
Earlier, analysts noted that Palantir was displaying operational strength but faced mild bearish pressure as technical momentum signaled further downside risk. The current analysis adds that, while long-term support remains intact amid ongoing enterprise outreach, traders should monitor the $175.41 resistance level for any indication of a shift in near-term price direction.











-
 Afghanistan
-
 Albania
-
 Algeria
-
 Angola
-
 Argentina
-
 Armenia
-
 Australia
-
 Austria
-
 Azerbaijan
-
 Bahamas
-
 Bahrain
-
 Bangladesh
-
 Belarus
-
 Belgium
-
 Bolivia
-
 Botswana
-
 Brazil
-
 Brunei
-
 Bulgaria
-
 Cambodia
-
 Cameroon
-
 Canada
-
 Chile
-
 China
-
 Colombia
-
 Congo
-
 Costa Rica
-
 Cote d'Ivoire
-
 Croatia
-
 Cuba
-
 Cyprus
-
 Czechia
-
 DR Congo
-
 Denmark
-
 Dominican Republic
-
 Ecuador
-
 Egypt
-
 El Salvador
-
 Estonia
-
 Eswatini
-
 Ethiopia
-
 Finland
-
 France
-
 Georgia
-
 Germany
-
 Ghana
-
 Greece
-
 Haiti
-
 Hong Kong
-
 Hungary
-
 India
-
 Indonesia
-
 Iran, Islamic republic
-
 Iraq
-
 Ireland
-
 Israel
-
 Italy
-
 Jamaica
-
 Japan
-
 Jordan
-
 Kazakhstan
-
 Kenya
-
 Korea
-
 Kuwait
-
 Kyrgyzstan
-
 Laos
-
 Latvia
-
 Lebanon
-
 Lesotho
-
 Libya
-
 Lithuania
-
 Luxembourg
-
 Madagascar
-
 Malaysia
-
 Malta
-
 Mauritius
-
 Mexico
-
 Moldova
-
 Mongolia
-
 Montenegro
-
 Morocco
-
 Mozambique
-
 Myanmar
-
 Namibia
-
 Nepal
-
 Netherlands
-
 New Zealand
-
 Nigeria
-
 North Macedonia
-
 Norway
-
 Oman
-
 Pakistan
-
 Palestine
-
 Panama
-
 Papua New Guinea
-
 Paraguay
-
 Peru
-
 Philippines
-
 Poland
-
 Portugal
-
 Puerto Rico
-
 Qatar
-
 Reunion
-
 Romania
-
 Rwanda
-
 Saudi Arabia
-
 Serbia
-
 Singapore
-
 Slovakia
-
 Slovenia
-
 Somalia
-
 South Africa
-
 Spain
-
 Sri Lanka
-
 Sweden
-
 Switzerland
-
 Syria
-
 Taiwan
-
 Tajikistan
-
 Tanzania
-
 Thailand
-
 Trinidad and Tobago
-
 Tunisia
-
 Turkey
-
 UAE
-
 Uganda
-
 Ukraine
-
 United Kingdom
-
United States
-
 Uruguay
-
 Uzbekistan
-
 Venezuela
-
 Vietnam
-
 Yemen
-
 Zambia
-
 Zimbabwe
- Forex
- Crypto












