

Intuit stock price prediction: Buyer support fuels resistance test

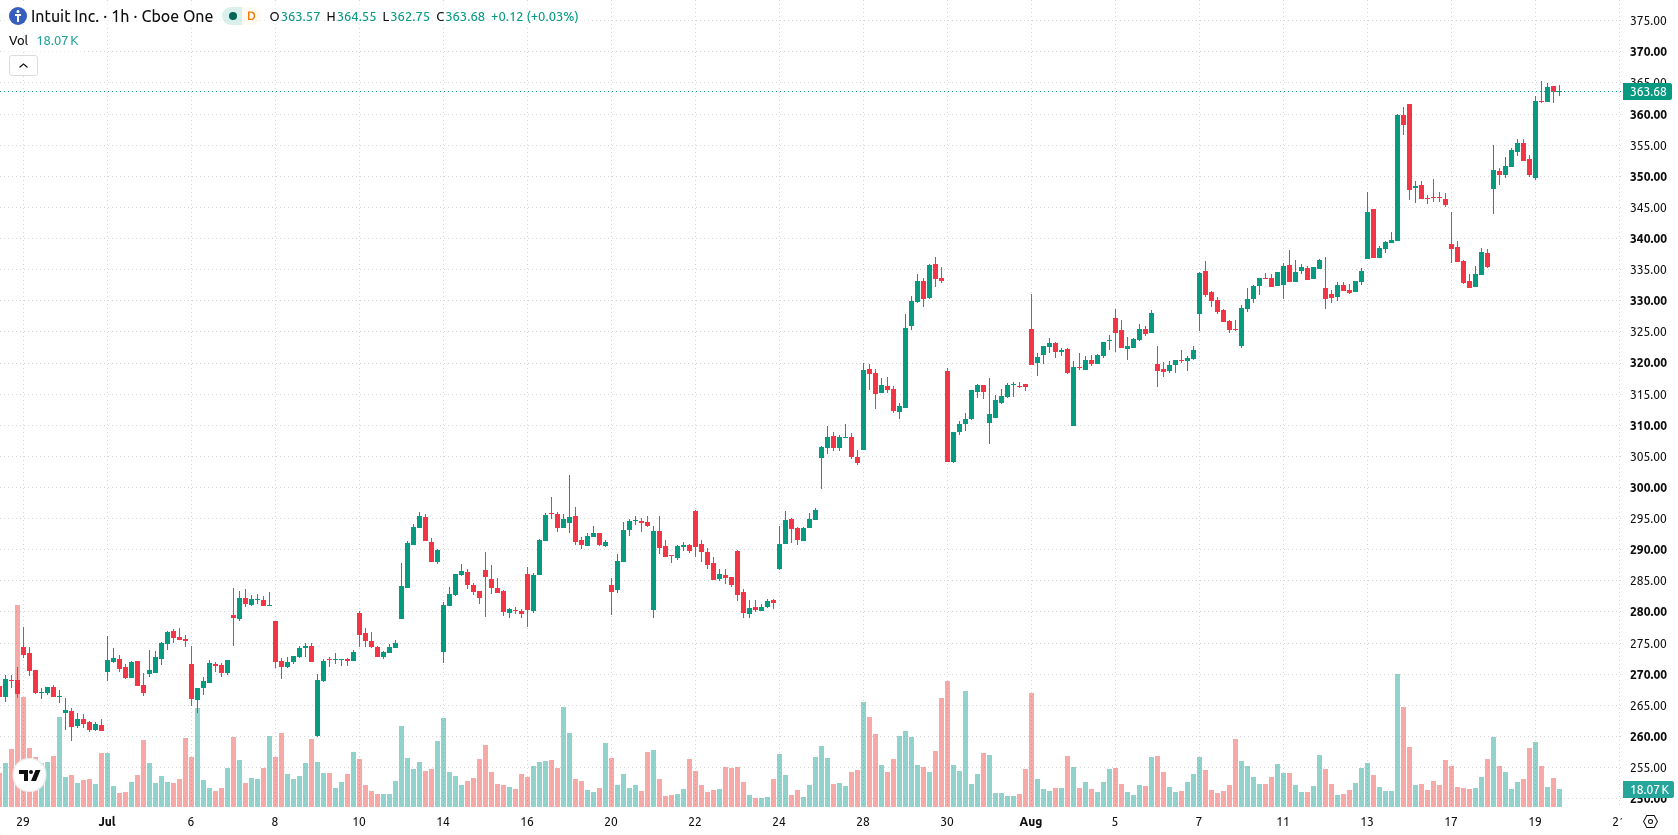
Intuit Inc. (INTU) stock is trading at $363.56 today, up 3.76% on the session with a notable gap at the open and moderate volatility. The stock sits above its key short- and medium-term moving averages, reflecting positive intraday momentum while remaining below its long-term trend benchmarks.
 332.03
351.38
Highlights
- Class action lawsuits have been filed against Intuit alleging overstated competitive positioning and unreliable TurboTax revenue guidance for 2026.
- Legal actions increase headline and reputational risk for Intuit, with an expanded lawsuit period reflecting persistent regulatory focus.
- Shares of Intuit rose 3.76% to $363.56 and are projected to trade within $350.59 to $376.53 with strong short-term bullish momentum but overbought technical conditions.
Legal risks rise as class actions challenge guidance and disclosures
Securities fraud class action lawsuits have been filed against Intuit Inc. in the United States District Court for the Northern District of California, centered on allegations that the company overstated its competitive standing and issued unreliable guidance for TurboTax revenue growth for full-year 2026, according to Theglobeandmail and Businesswire. These legal actions introduce headline risk and raise the prospect of increased legal and reputational costs, which may affect investor sentiment and drive volatility in the short term. The expansion of the lawsuit class period further highlights ongoing scrutiny of Intuit's past disclosures.
Overbought signals intensify as bullish momentum meets key resistance
On the hourly chart, INTU is trading above the MA-20 at $347.86 and the MA-50 at $342.26, but remains below the long-term MA-200 on the daily timeframe at $446.99. The Ichimoku Kijun line is positioned at $348.69, establishing a key immediate support level. MACD, ADX, and the Awesome Oscillator continue to confirm strong intraday bullish momentum. The RSI stands at 68.94, while Stochastic RSI, CCI, and Bull/Bear Power all indicate overbought conditions, suggesting robust buying interest at current levels but also signaling a potential for near-term consolidation or pullback.
Upside bias prevails as volatility bands define breakout potential
Over the next two to three sessions, INTU is expected to remain within a typical volatility band between $350.59 and $376.53. The likelihood of continued gains is high at 78%, while the chance of a reversal is estimated at 22%. Price consolidation is probable within this range; a breakout above $376.53 could open the way for further upside, while a drop below $350.59 would expose the market to renewed selling.
Earlier, analysts noted that Intuit shares were exhibiting strong upward momentum as traders positioned ahead of key earnings and technical levels. The emergence of securities fraud lawsuits now adds a significant legal and reputational risk factor, making the $376.53 resistance a critical inflection point for potential volatility in the sessions ahead.











-
 Afghanistan
-
 Albania
-
 Algeria
-
 Angola
-
 Argentina
-
 Armenia
-
 Australia
-
 Austria
-
 Azerbaijan
-
 Bahamas
-
 Bahrain
-
 Bangladesh
-
 Belarus
-
 Belgium
-
 Bolivia
-
 Botswana
-
 Brazil
-
 Brunei
-
 Bulgaria
-
 Cambodia
-
 Cameroon
-
 Canada
-
 Chile
-
 China
-
 Colombia
-
 Congo
-
 Costa Rica
-
 Cote d'Ivoire
-
 Croatia
-
 Cuba
-
 Cyprus
-
 Czechia
-
 DR Congo
-
 Denmark
-
 Dominican Republic
-
 Ecuador
-
 Egypt
-
 El Salvador
-
 Estonia
-
 Eswatini
-
 Ethiopia
-
 Finland
-
 France
-
 Georgia
-
 Germany
-
 Ghana
-
 Greece
-
 Haiti
-
 Hong Kong
-
 Hungary
-
 India
-
 Indonesia
-
 Iran, Islamic republic
-
 Iraq
-
 Ireland
-
 Israel
-
 Italy
-
 Jamaica
-
 Japan
-
 Jordan
-
 Kazakhstan
-
 Kenya
-
 Korea
-
 Kuwait
-
 Kyrgyzstan
-
 Laos
-
 Latvia
-
 Lebanon
-
 Lesotho
-
 Libya
-
 Lithuania
-
 Luxembourg
-
 Madagascar
-
 Malaysia
-
 Malta
-
 Mauritius
-
 Mexico
-
 Moldova
-
 Mongolia
-
 Montenegro
-
 Morocco
-
 Mozambique
-
 Myanmar
-
 Namibia
-
 Nepal
-
 Netherlands
-
 New Zealand
-
 Nigeria
-
 North Macedonia
-
 Norway
-
 Oman
-
 Pakistan
-
 Palestine
-
 Panama
-
 Papua New Guinea
-
 Paraguay
-
 Peru
-
 Philippines
-
 Poland
-
 Portugal
-
 Puerto Rico
-
 Qatar
-
 Reunion
-
 Romania
-
 Rwanda
-
 Saudi Arabia
-
 Serbia
-
 Singapore
-
 Slovakia
-
 Slovenia
-
 Somalia
-
 South Africa
-
 Spain
-
 Sri Lanka
-
 Sweden
-
 Switzerland
-
 Syria
-
 Taiwan
-
 Tajikistan
-
 Tanzania
-
 Thailand
-
 Trinidad and Tobago
-
 Tunisia
-
 Turkey
-
 UAE
-
 Uganda
-
 Ukraine
-
 United Kingdom
-
United States
-
 Uruguay
-
 Uzbekistan
-
 Venezuela
-
 Vietnam
-
 Yemen
-
 Zambia
-
 Zimbabwe
- Forex
- Crypto












