

Dutch Bros stock outlook: Resistance test and technical signals

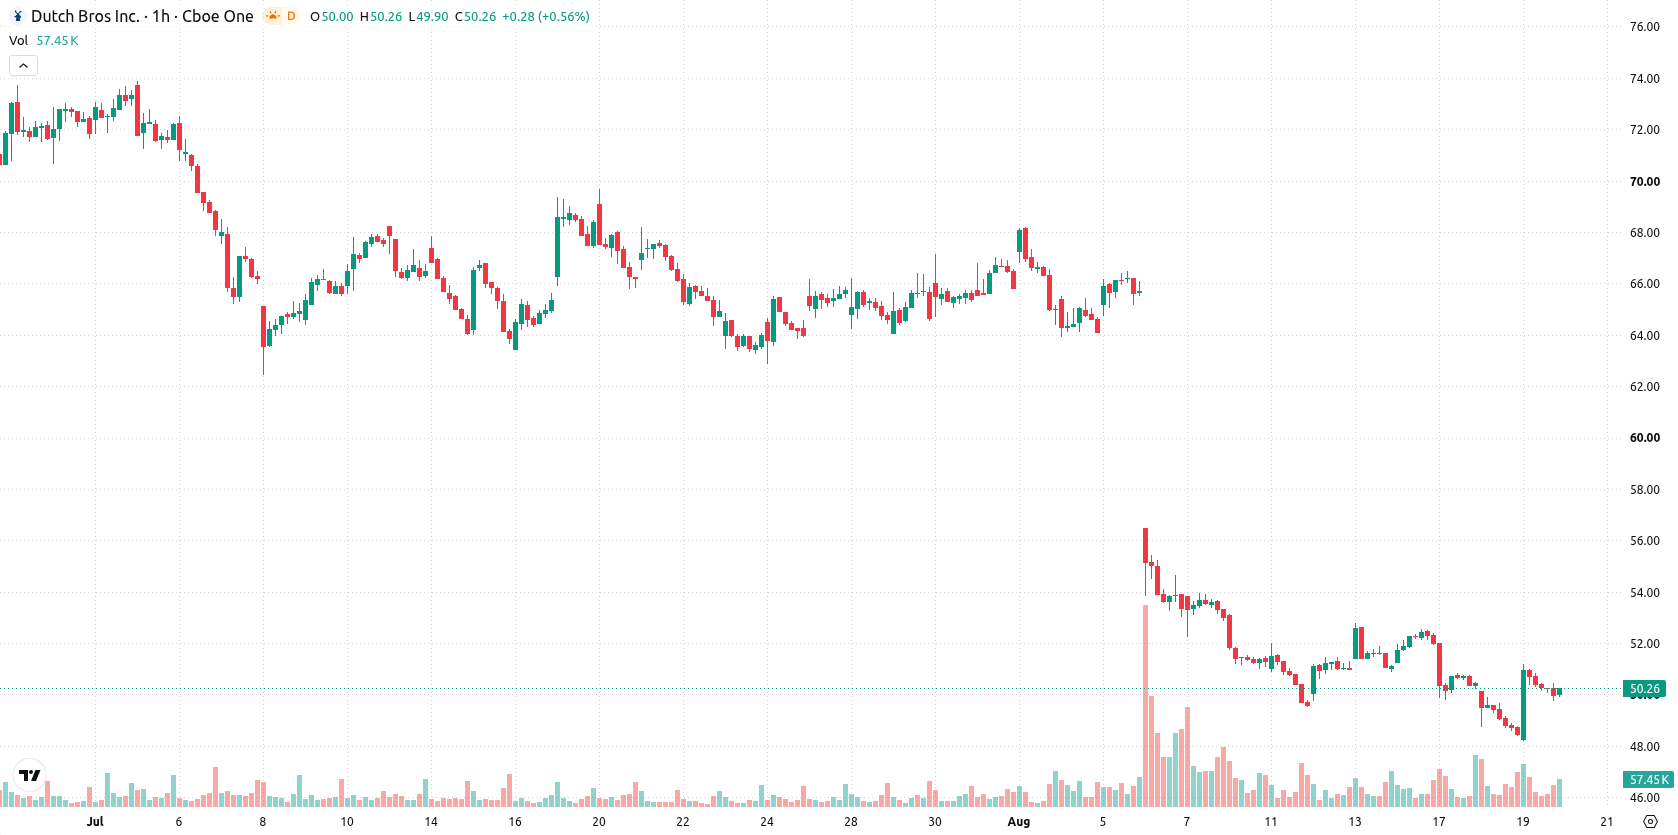
Dutch Bros (BROS) stock is trading at $50.27, up 3.78% on the day and closing near the session high. The price is currently above its key short-term moving average, while remaining under pressure from the medium- and longer-term trend levels.
 35.69
37.45
Highlights
- BROS stock is trading above short-term moving averages but remains below medium- and long-term resistance levels.
- Momentum indicators show weakening underlying trend with mixed oscillator readings, including overbought warnings and strong intraday buyer pressure.
- Over the next 2 to 3 trading days, BROS stock is expected to move within a $48.19 to $52.35 range, with a 58% probability of downside.
Mixed momentum as resistance caps price and signals diverge
BROS is trading above the MA-20 ($49.98), but remains below the MA-50 ($50.78) on the hourly chart and below the MA-200 ($57.54) on the daily. Immediate resistance is marked by the Ichimoku Kijun at $50.31. Momentum signals are mixed: MACD and ADX indicate Sell, RSI stands at 48.34 in Sell territory but not oversold, Stochastic RSI is Overbought, and CCI is Neutral. Bull/Bear Power points to Strong Buy, while Awesome Oscillator is Neutral, reflecting a blend of intraday buyer dominance and underlying momentum softness.
Downside bias prevails as volatility and resistance shape outlook
Over the next 2–3 trading days, BROS is expected to fluctuate within a $48.19 to $52.35 volatility band relative to current levels. The probability of further upside stands at 42%, while the probability of downside is 58%, making additional declines the more likely scenario. Baseline expectations point to continued sideways trading; a decisive move above immediate resistance would trigger a bullish scenario, while a drop below support would reinforce further weakness.
Earlier, analysts noted that Dutch Bros remained under sustained technical pressure despite temporary rebounds. The current analysis adds nuance by highlighting increased intraday buying interest, but with upside risks still limited, traders should monitor the $50.31 resistance for signs of a sustained breakout.






Latest Dutch Bros News




-
 Afghanistan
-
 Albania
-
 Algeria
-
 Angola
-
 Argentina
-
 Armenia
-
 Australia
-
 Austria
-
 Azerbaijan
-
 Bahamas
-
 Bahrain
-
 Bangladesh
-
 Belarus
-
 Belgium
-
 Bolivia
-
 Botswana
-
 Brazil
-
 Brunei
-
 Bulgaria
-
 Cambodia
-
 Cameroon
-
 Canada
-
 Chile
-
 China
-
 Colombia
-
 Congo
-
 Costa Rica
-
 Cote d'Ivoire
-
 Croatia
-
 Cuba
-
 Cyprus
-
 Czechia
-
 DR Congo
-
 Denmark
-
 Dominican Republic
-
 Ecuador
-
 Egypt
-
 El Salvador
-
 Estonia
-
 Eswatini
-
 Ethiopia
-
 Finland
-
 France
-
 Georgia
-
 Germany
-
 Ghana
-
 Greece
-
 Haiti
-
 Hong Kong
-
 Hungary
-
 India
-
 Indonesia
-
 Iran, Islamic republic
-
 Iraq
-
 Ireland
-
 Israel
-
 Italy
-
 Jamaica
-
 Japan
-
 Jordan
-
 Kazakhstan
-
 Kenya
-
 Korea
-
 Kuwait
-
 Kyrgyzstan
-
 Laos
-
 Latvia
-
 Lebanon
-
 Lesotho
-
 Libya
-
 Lithuania
-
 Luxembourg
-
 Madagascar
-
 Malaysia
-
 Malta
-
 Mauritius
-
 Mexico
-
 Moldova
-
 Mongolia
-
 Montenegro
-
 Morocco
-
 Mozambique
-
 Myanmar
-
 Namibia
-
 Nepal
-
 Netherlands
-
 New Zealand
-
 Nigeria
-
 North Macedonia
-
 Norway
-
 Oman
-
 Pakistan
-
 Palestine
-
 Panama
-
 Papua New Guinea
-
 Paraguay
-
 Peru
-
 Philippines
-
 Poland
-
 Portugal
-
 Puerto Rico
-
 Qatar
-
 Reunion
-
 Romania
-
 Rwanda
-
 Saudi Arabia
-
 Serbia
-
 Singapore
-
 Slovakia
-
 Slovenia
-
 Somalia
-
 South Africa
-
 Spain
-
 Sri Lanka
-
 Sweden
-
 Switzerland
-
 Syria
-
 Taiwan
-
 Tajikistan
-
 Tanzania
-
 Thailand
-
 Trinidad and Tobago
-
 Tunisia
-
 Turkey
-
 UAE
-
 Uganda
-
 Ukraine
-
 United Kingdom
-
United States
-
 Uruguay
-
 Uzbekistan
-
 Venezuela
-
 Vietnam
-
 Yemen
-
 Zambia
-
 Zimbabwe
- Forex
- Crypto












