

National Grid stock outlook: Consolidation near GBX1,196 resistance

National Grid (NG) stock is trading at GBX1,183.50 with a modest rise over the prior session. The price remains below its key moving averages, reflecting subdued short-term momentum.
 1260.50
1302.50
Highlights
- National Grid maintains stable earnings and cash flow by combining regulated or contracted revenues with large-scale infrastructure investments.
- The companies income-focused structure continues to attract long-term investors seeking consistent returns and resilience during periods of high capital expenditure.
- Shares of National Grid trade under key averages and face continued downside with a 76% probability of declining to a range of GBX1,162 to GBX1,199.
Stable cash flows as regulated earnings support fresh investment
National Grid combines regulated or contracted earnings with significant infrastructure investment programmes, a structure that ensures relatively stable cash flows while enabling ongoing capital deployment. This business model supports consistent earnings generation and appeals to long-term investors seeking income and resilience. Such characteristics underpin the company's current market context as it navigates investment demands.
Oversold momentum as multiple technical barriers hold
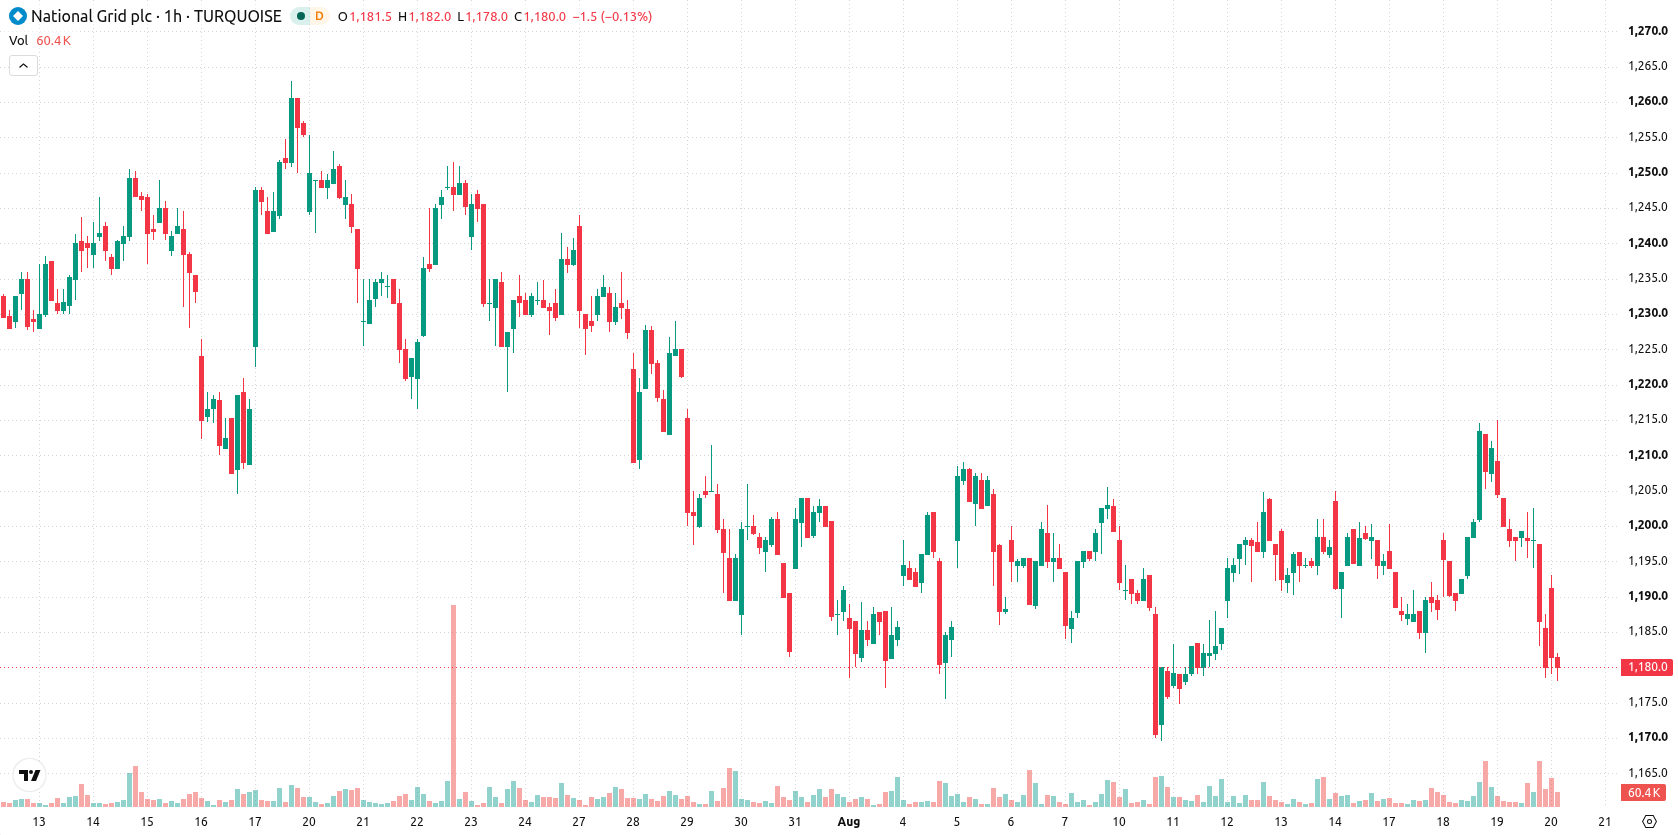
On the hourly chart, NG is trading beneath the MA-20 at GBX1,195 and the MA-50 at GBX1,194, with the daily MA-200 sitting higher at GBX1,233. The Ichimoku Kijun level at GBX1,196 marks immediate resistance. Momentum indicators are weak, as MACD gives a Sell signal and ADX is Neutral. RSI reads 35.7 (Sell), while Stochastic RSI, CCI, and Bull/Bear Power collectively indicate an oversold environment with sustained seller dominance. The Awesome Oscillator is also aligned with the prevailing sell signals.
Downside bias as probability favors range-bound losses
Over the next 2 to 3 trading days, NG is expected to fluctuate within a volatility band from GBX1,162 to GBX1,199. The probability of an upside move stands at 24%, with a 76% likelihood of further downside movement. Base case is for sideways action within this range; a break above GBX1,196 could lead to a rebound, while a drop below GBX1,162 would suggest renewed short-term weakness.
Earlier, analysts noted that National Grid was experiencing heightened selling pressure as the stock traded below major moving averages, emphasizing downside risk. The current analysis strengthens this view, noting persistent weak momentum and oversold conditions, with GBX1,162 as a key level to watch for renewed downside if breached.









-
 Afghanistan
-
 Albania
-
 Algeria
-
 Angola
-
 Argentina
-
 Armenia
-
 Australia
-
 Austria
-
 Azerbaijan
-
 Bahamas
-
 Bahrain
-
 Bangladesh
-
 Belarus
-
 Belgium
-
 Bolivia
-
 Botswana
-
 Brazil
-
 Brunei
-
 Bulgaria
-
 Cambodia
-
 Cameroon
-
 Canada
-
 Chile
-
 China
-
 Colombia
-
 Congo
-
 Costa Rica
-
 Cote d'Ivoire
-
 Croatia
-
 Cuba
-
 Cyprus
-
 Czechia
-
 DR Congo
-
 Denmark
-
 Dominican Republic
-
 Ecuador
-
 Egypt
-
 El Salvador
-
 Estonia
-
 Eswatini
-
 Ethiopia
-
 Finland
-
 France
-
 Georgia
-
 Germany
-
 Ghana
-
 Greece
-
 Haiti
-
 Hong Kong
-
 Hungary
-
 India
-
 Indonesia
-
 Iran, Islamic republic
-
 Iraq
-
 Ireland
-
 Israel
-
 Italy
-
 Jamaica
-
 Japan
-
 Jordan
-
 Kazakhstan
-
 Kenya
-
 Korea
-
 Kuwait
-
 Kyrgyzstan
-
 Laos
-
 Latvia
-
 Lebanon
-
 Lesotho
-
 Libya
-
 Lithuania
-
 Luxembourg
-
 Madagascar
-
 Malaysia
-
 Malta
-
 Mauritius
-
 Mexico
-
 Moldova
-
 Mongolia
-
 Montenegro
-
 Morocco
-
 Mozambique
-
 Myanmar
-
 Namibia
-
 Nepal
-
 Netherlands
-
 New Zealand
-
 Nigeria
-
 North Macedonia
-
 Norway
-
 Oman
-
 Pakistan
-
 Palestine
-
 Panama
-
 Papua New Guinea
-
 Paraguay
-
 Peru
-
 Philippines
-
 Poland
-
 Portugal
-
 Puerto Rico
-
 Qatar
-
 Reunion
-
 Romania
-
 Rwanda
-
 Saudi Arabia
-
 Serbia
-
 Singapore
-
 Slovakia
-
 Slovenia
-
 Somalia
-
 South Africa
-
 Spain
-
 Sri Lanka
-
 Sweden
-
 Switzerland
-
 Syria
-
 Taiwan
-
 Tajikistan
-
 Tanzania
-
 Thailand
-
 Trinidad and Tobago
-
 Tunisia
-
 Turkey
-
 UAE
-
 Uganda
-
 Ukraine
-
 United Kingdom
-
United States
-
 Uruguay
-
 Uzbekistan
-
 Venezuela
-
 Vietnam
-
 Yemen
-
 Zambia
-
 Zimbabwe
- Forex
- Crypto












