


Tilray (TLRY) stock is trading at $4.64 after a daily decline of 4.16%. The price has moved lower on the session and is currently positioned below its key moving averages, indicating a weaker short-term technical setup.
 2.67
2.80
Highlights
- Tilray Brands reported record fiscal 2026 revenue of $915 million, up 11%, with adjusted EBITDA also rising 11% to $61.1 million.
- Adjusted net income almost doubled to $12.2 million, but statutory expenses led to a GAAP net loss of $49.6 million and adjusted earnings missed forecasts.
- Shares of Tilray trade below key moving averages and face resistance at $4.68, with expected range between $4.39 and $4.89 as technical signals diverge.
Net loss tempers revenue growth as earnings miss forecasts
Tilray Brands reported record revenue for fiscal year 2026, climbing 11% to approximately $915 million alongside an 11% increase in adjusted EBITDA to $61.1 million. Despite nearly doubling its adjusted net income to $12.2 million, the company recorded a GAAP net loss attributable to shareholders of $49.6 million, reflecting ongoing statutory expenses. According to Finance Yahoo, adjusted earnings also missed sell-side forecasts, tempering the operational progress amid continued investor caution.
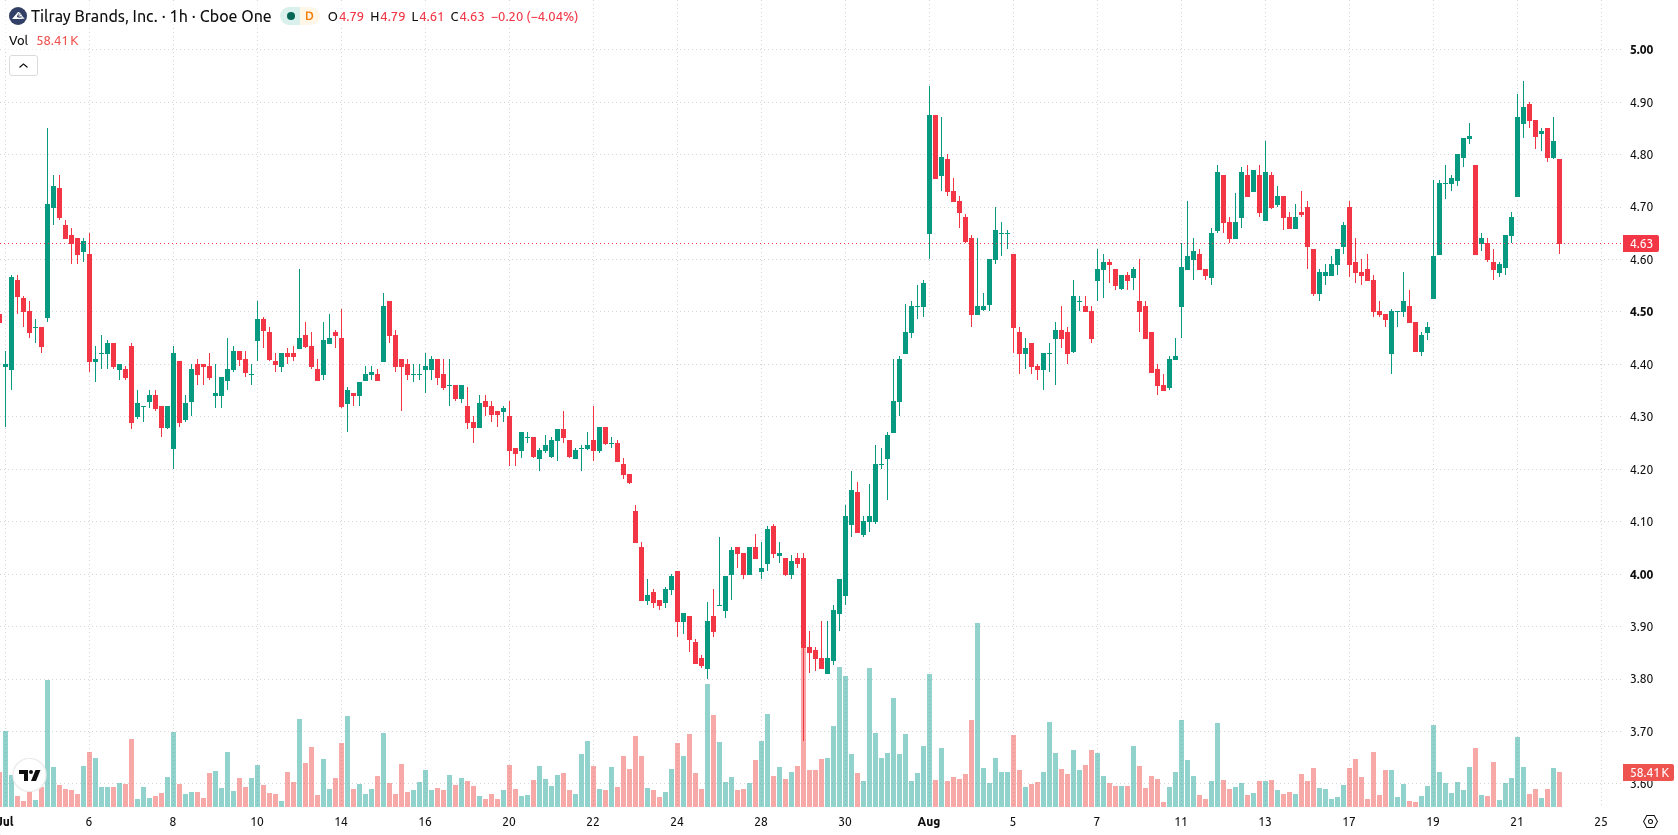
Mixed momentum signals contrast with resistance near key tech levels
On the H1 chart, TLRY is below the MA-20 at $4.75 and the MA-50 at $4.65, while the daily chart shows the price under the MA-200 at $7. The Ichimoku Kijun stands at $4.68, acting as immediate resistance for any rebound. Momentum signals are mixed: MACD, RSI, Stochastic RSI, CCI, and Bull/Bear Power all register buy signals or suggest buyer dominance, but ADX and the Awesome Oscillator remain neutral, providing no confirmation of a strong emerging trend. This technical mix highlights a clash between ongoing price weakness and underlying bullish momentum readings.
Range-bound outlook prevails while price tests resistance
In the short term, TLRY is expected to trade within a range of $4.39 to $4.89, reflecting the prevailing volatility band relative to current levels. The probability of an upward move is very high, while further downside is viewed as unlikely. Unless the price breaks above the $4.68 resistance, TLRY is likely to remain in this sideways corridor; a move below $4.39 would indicate renewed bearish momentum, whereas a sustained break above $4.68 may trigger a more significant rebound.
Previously it was reported that Tilray's increased production capacity and strategic acquisitions positioned the company to leverage growing international demand, while market conditions signaled potential price consolidation. The current technical and financial landscape adds a layer of complexity, making the $4.68 resistance a pivotal level to watch for any potential shift from the prevailing sideways range.






Latest Tilray Brands News




-
 Afghanistan
-
 Albania
-
 Algeria
-
 Angola
-
 Argentina
-
 Armenia
-
 Australia
-
 Austria
-
 Azerbaijan
-
 Bahamas
-
 Bahrain
-
 Bangladesh
-
 Belarus
-
 Belgium
-
 Bolivia
-
 Botswana
-
 Brazil
-
 Brunei
-
 Bulgaria
-
 Cambodia
-
 Cameroon
-
 Canada
-
 Chile
-
 China
-
 Colombia
-
 Congo
-
 Costa Rica
-
 Cote d'Ivoire
-
 Croatia
-
 Cuba
-
 Cyprus
-
 Czechia
-
 DR Congo
-
 Denmark
-
 Dominican Republic
-
 Ecuador
-
 Egypt
-
 El Salvador
-
 Estonia
-
 Eswatini
-
 Ethiopia
-
 Finland
-
 France
-
 Georgia
-
 Germany
-
 Ghana
-
 Greece
-
 Haiti
-
 Hong Kong
-
 Hungary
-
 India
-
 Indonesia
-
 Iran, Islamic republic
-
 Iraq
-
 Ireland
-
 Israel
-
 Italy
-
 Jamaica
-
 Japan
-
 Jordan
-
 Kazakhstan
-
 Kenya
-
 Korea
-
 Kuwait
-
 Kyrgyzstan
-
 Laos
-
 Latvia
-
 Lebanon
-
 Lesotho
-
 Libya
-
 Lithuania
-
 Luxembourg
-
 Madagascar
-
 Malaysia
-
 Malta
-
 Mauritius
-
 Mexico
-
 Moldova
-
 Mongolia
-
 Montenegro
-
 Morocco
-
 Mozambique
-
 Myanmar
-
 Namibia
-
 Nepal
-
 Netherlands
-
 New Zealand
-
 Nigeria
-
 North Macedonia
-
 Norway
-
 Oman
-
 Pakistan
-
 Palestine
-
 Panama
-
 Papua New Guinea
-
 Paraguay
-
 Peru
-
 Philippines
-
 Poland
-
 Portugal
-
 Puerto Rico
-
 Qatar
-
 Reunion
-
 Romania
-
 Rwanda
-
 Saudi Arabia
-
 Serbia
-
 Singapore
-
 Slovakia
-
 Slovenia
-
 Somalia
-
 South Africa
-
 Spain
-
 Sri Lanka
-
 Sweden
-
 Switzerland
-
 Syria
-
 Taiwan
-
 Tajikistan
-
 Tanzania
-
 Thailand
-
 Trinidad and Tobago
-
 Tunisia
-
 Turkey
-
 UAE
-
 Uganda
-
 Ukraine
-
 United Kingdom
-
United States
-
 Uruguay
-
 Uzbekistan
-
 Venezuela
-
 Vietnam
-
 Yemen
-
 Zambia
-
 Zimbabwe
- Forex
- Crypto












