

Exxon Mobil shares weekly forecast: Recovery steadies amid mixed momentum signals and narrow trading range

Shares of Exxon Mobil Corporation (XOM) are trading near $164 as the recovery holds, but technical signals show a stretched setup heading into the new week. The focus now shifts to how recent corporate updates might influence sentiment in a tight trading band as momentum appears limited.
 166.64
183.82
Highlights
- Shares of Exxon Mobil edged lower by $1.08 over the past 7 days to $164.19, maintaining a flat trend within a narrow range.
- Technical momentum indicators are signaling overbought conditions, with limited upside before a potential pause in the rally.
- Next week, shares are projected to consolidate between $161.77 and $170.73, with key resistance at $168.64 and support at $163.25.
Profit beats revenue as asset moves and project news shape sentiment
Exxon Mobil reported $14.7 billion in quarterly profit for the period ending July 31, 2026, marking its highest result in four years, though this was below EPS forecasts, according to Yahoo Finance. The company also generated $116 billion in revenue for the second quarter, a 42.3% year-on-year increase as highlighted by StockStory. Exxon Mobil maintained its $4.12 annualized dividend per share and updated guidance on its Tengiz oil project, while pointing to shifts in asset manager holdings and ongoing negotiations over Kazakhstan's Kashagan field, according to Simply Wall St News.
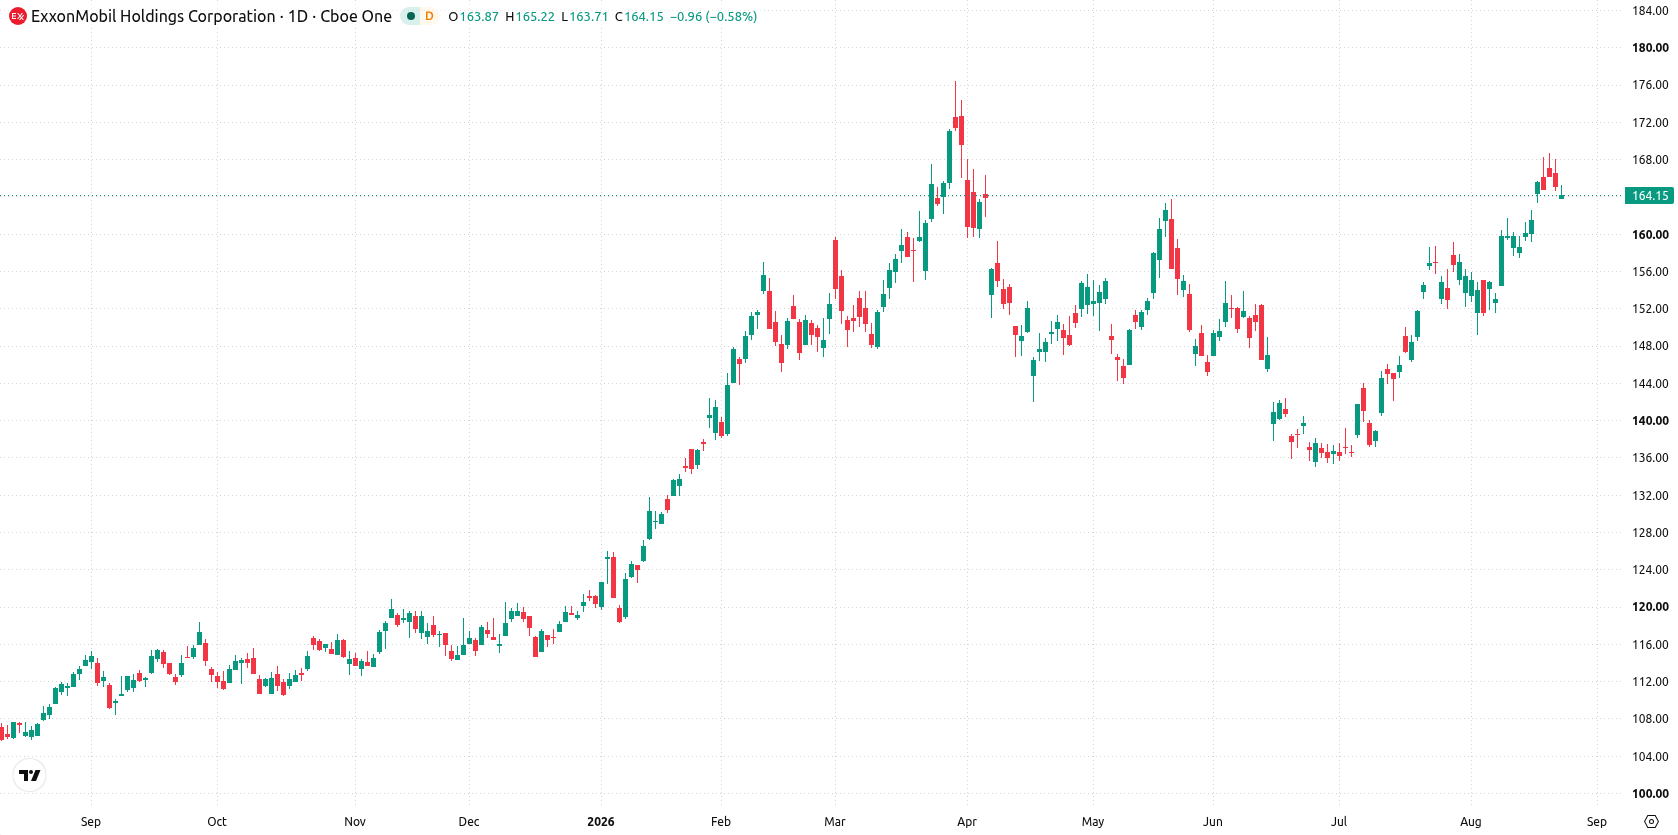
Momentum exhaustion signals pause risk as XOM tests range boundaries
On the daily chart, the stock shows a flat trend and a contained move within a narrow range, with volatility at 3.3%. Momentum readings are mixed: the RSI at 68.29 is approaching overbought, while CCI and Stochastic RSI are both already in the overbought zone. Immediate support is visible at $163.25, with resistance at $168.64, and the Ichimoku Kijun at $157.44 acting as a secondary support. Momentum looks stretched, suggesting limited room for further upside before a possible pause.
Consolidation likely with breakout risks as weekly range holds
Next week, the expected range is $161.77 to $170.73, with a 77% probability of an increase and a 23% chance of a decrease. The base case is continued consolidation within this band. A bullish break above $168.64 would open further gains toward the top of the expected range. If the price falters below $163.25, a test of lower support levels becomes more likely.
Earlier, analysts noted that Exxon Mobil's technical structure and consistent shareholder returns had anchored a bullish outlook despite some overbought signals. The current setup adds a layer of caution, as mixed momentum readings and flat price action suggest traders should watch the $168.64 resistance for signs of a decisive move outside the prevailing narrow range.











-
 Afghanistan
-
 Albania
-
 Algeria
-
 Angola
-
 Argentina
-
 Armenia
-
 Australia
-
 Austria
-
 Azerbaijan
-
 Bahamas
-
 Bahrain
-
 Bangladesh
-
 Belarus
-
 Belgium
-
 Bolivia
-
 Botswana
-
 Brazil
-
 Brunei
-
 Bulgaria
-
 Cambodia
-
 Cameroon
-
 Canada
-
 Chile
-
 China
-
 Colombia
-
 Congo
-
 Costa Rica
-
 Cote d'Ivoire
-
 Croatia
-
 Cuba
-
 Cyprus
-
 Czechia
-
 DR Congo
-
 Denmark
-
 Dominican Republic
-
 Ecuador
-
 Egypt
-
 El Salvador
-
 Estonia
-
 Eswatini
-
 Ethiopia
-
 Finland
-
 France
-
 Georgia
-
 Germany
-
 Ghana
-
 Greece
-
 Haiti
-
 Hong Kong
-
 Hungary
-
 India
-
 Indonesia
-
 Iran, Islamic republic
-
 Iraq
-
 Ireland
-
 Israel
-
 Italy
-
 Jamaica
-
 Japan
-
 Jordan
-
 Kazakhstan
-
 Kenya
-
 Korea
-
 Kuwait
-
 Kyrgyzstan
-
 Laos
-
 Latvia
-
 Lebanon
-
 Lesotho
-
 Libya
-
 Lithuania
-
 Luxembourg
-
 Madagascar
-
 Malaysia
-
 Malta
-
 Mauritius
-
 Mexico
-
 Moldova
-
 Mongolia
-
 Montenegro
-
 Morocco
-
 Mozambique
-
 Myanmar
-
 Namibia
-
 Nepal
-
 Netherlands
-
 New Zealand
-
 Nigeria
-
 North Macedonia
-
 Norway
-
 Oman
-
 Pakistan
-
 Palestine
-
 Panama
-
 Papua New Guinea
-
 Paraguay
-
 Peru
-
 Philippines
-
 Poland
-
 Portugal
-
 Puerto Rico
-
 Qatar
-
 Reunion
-
 Romania
-
 Rwanda
-
 Saudi Arabia
-
 Serbia
-
 Singapore
-
 Slovakia
-
 Slovenia
-
 Somalia
-
 South Africa
-
 Spain
-
 Sri Lanka
-
 Sweden
-
 Switzerland
-
 Syria
-
 Taiwan
-
 Tajikistan
-
 Tanzania
-
 Thailand
-
 Trinidad and Tobago
-
 Tunisia
-
 Turkey
-
 UAE
-
 Uganda
-
 Ukraine
-
 United Kingdom
-
United States
-
 Uruguay
-
 Uzbekistan
-
 Venezuela
-
 Vietnam
-
 Yemen
-
 Zambia
-
 Zimbabwe
- Forex
- Crypto












