


Technical momentum is propelling Godaddy Inc (GDDY) sharply higher, with the stock up 3.2% today as buyers capitalize on bullish short- and long-term trends. The advance is supported by strong price action above all major moving averages, highlighting continued upward conviction.
 104.63
105.35
104.63
105.35
Highlights
- Shares of Godaddy advanced 3.2% and opened with an upside gap of about 1% near session highs.
- Technical indicators show a bullish bias with buyer dominance and some oscillators flagging overbought conditions.
- For the next five trading days, the expected range is $97.52 to $103.41, with 67% probability of an upward move.
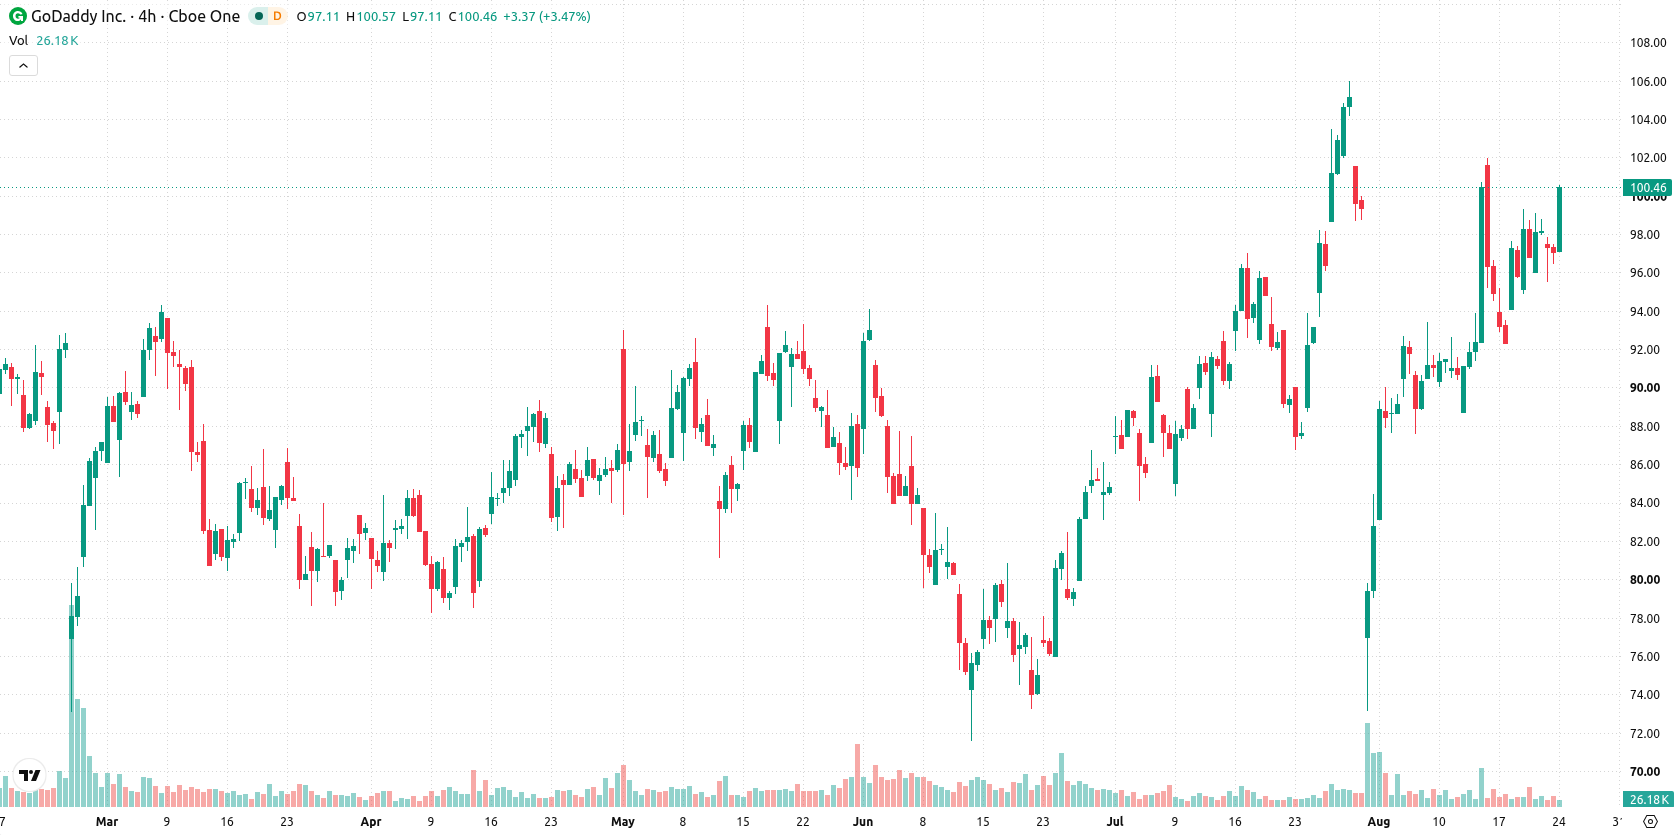
Bullish momentum reinforced as price nears resistance and indicators diverge
Godaddy is trading above its 20-day ($94.35), 50-day ($88.99), and 200-day ($97.77) moving averages, reinforcing a bullish bias across short-, medium-, and long-term trends. The nearest ceiling is set at $100.64 and near-term support is seen at $99.41. Momentum signals show strength, with the Moving Average Convergence Divergence (MACD) indicating a buy and the Average Directional Index (ADX) reflecting a neutral trend. The Relative Strength Index (RSI) sits at 55.17 with a buy forecast, confirming modest positive momentum, while Stochastic RSI signals a short-term sell and the Commodity Channel Index (CCI) is neutral, highlighting some divergence among oscillators. Bull/Bear Power (BBP) value of 2.98 points to clear buyer dominance and flags overbought conditions. Today, the stock advanced $3.11 or 3.2% higher, opening with an upside gap of about 1%. The price is near the session high, and intraday volatility stands at 2.84%. The tone favors strength toward the highs, with buyers driving momentum upward.
Earlier, analysts noted that GoDaddy's improved cybersecurity posture and increased financial flexibility could influence its trading direction amid mixed technical signals. The current trend strengthens that outlook, with sustained momentum suggesting that traders should monitor the $100.64 resistance as a key inflection point for potential breakout or reversal.









-
 Afghanistan
-
 Albania
-
 Algeria
-
 Angola
-
 Argentina
-
 Armenia
-
 Australia
-
 Austria
-
 Azerbaijan
-
 Bahamas
-
 Bahrain
-
 Bangladesh
-
 Belarus
-
 Belgium
-
 Bolivia
-
 Botswana
-
 Brazil
-
 Brunei
-
 Bulgaria
-
 Cambodia
-
 Cameroon
-
 Canada
-
 Chile
Chile
-
 China
China
-
 Colombia
-
 Congo
Congo
-
 Costa Rica
-
 Cote d'Ivoire
-
 Croatia
-
 Cuba
Cuba
-
 Cyprus
-
 Czechia
-
 DR Congo
-
 Denmark
-
 Dominican Republic
-
 Ecuador
-
 Egypt
Egypt
-
 El Salvador
-
 Estonia
-
 Eswatini
-
 Ethiopia
-
 Finland
-
 France
-
 Georgia
-
 Germany
-
 Ghana
Ghana
-
 Greece
-
 Haiti
Haiti
-
 Hong Kong
-
 Hungary
-
 India
India
-
 Indonesia
-
 Iran, Islamic republic
-
 Iraq
Iraq
-
 Ireland
-
 Israel
-
 Italy
Italy
-
 Jamaica
-
 Japan
Japan
-
 Jordan
-
 Kazakhstan
-
 Kenya
Kenya
-
 Korea
Korea
-
 Kuwait
-
 Kyrgyzstan
-
 Laos
Laos
-
 Latvia
-
 Lebanon
-
 Lesotho
-
 Libya
Libya
-
 Lithuania
-
 Luxembourg
-
 Madagascar
-
 Malaysia
-
 Malta
Malta
-
 Mauritius
-
 Mexico
-
 Moldova
-
 Mongolia
-
 Montenegro
-
 Morocco
-
 Mozambique
-
 Myanmar
-
 Namibia
-
 Nepal
Nepal
-
 Netherlands
-
 New Zealand
-
 Nigeria
-
 North Macedonia
-
 Norway
-
 Oman
Oman
-
 Pakistan
-
 Palestine
-
 Panama
-
 Papua New Guinea
-
 Paraguay
-
 Peru
Peru
-
 Philippines
-
 Poland
-
 Portugal
-
 Puerto Rico
-
 Qatar
Qatar
-
 Reunion
-
 Romania
-
 Rwanda
-
 Saudi Arabia
-
 Serbia
-
 Singapore
-
 Slovakia
-
 Slovenia
-
 Somalia
-
 South Africa
-
 Spain
Spain
-
 Sri Lanka
-
 Sweden
-
 Switzerland
-
 Syria
Syria
-
 Taiwan
-
 Tajikistan
-
 Tanzania
-
 Thailand
-
 Trinidad and Tobago
-
 Tunisia
-
 Turkey
-
 UAE
UAE
-
 Uganda
-
 Ukraine
-
 United Kingdom
-
United States
-
 Uruguay
-
 Uzbekistan
-
 Venezuela
-
 Vietnam
-
 Yemen
Yemen
-
 Zambia
-
 Zimbabwe
- Forex
- Crypto












