

JB Hunt shares drop more than 5% after breaking below key moving averages

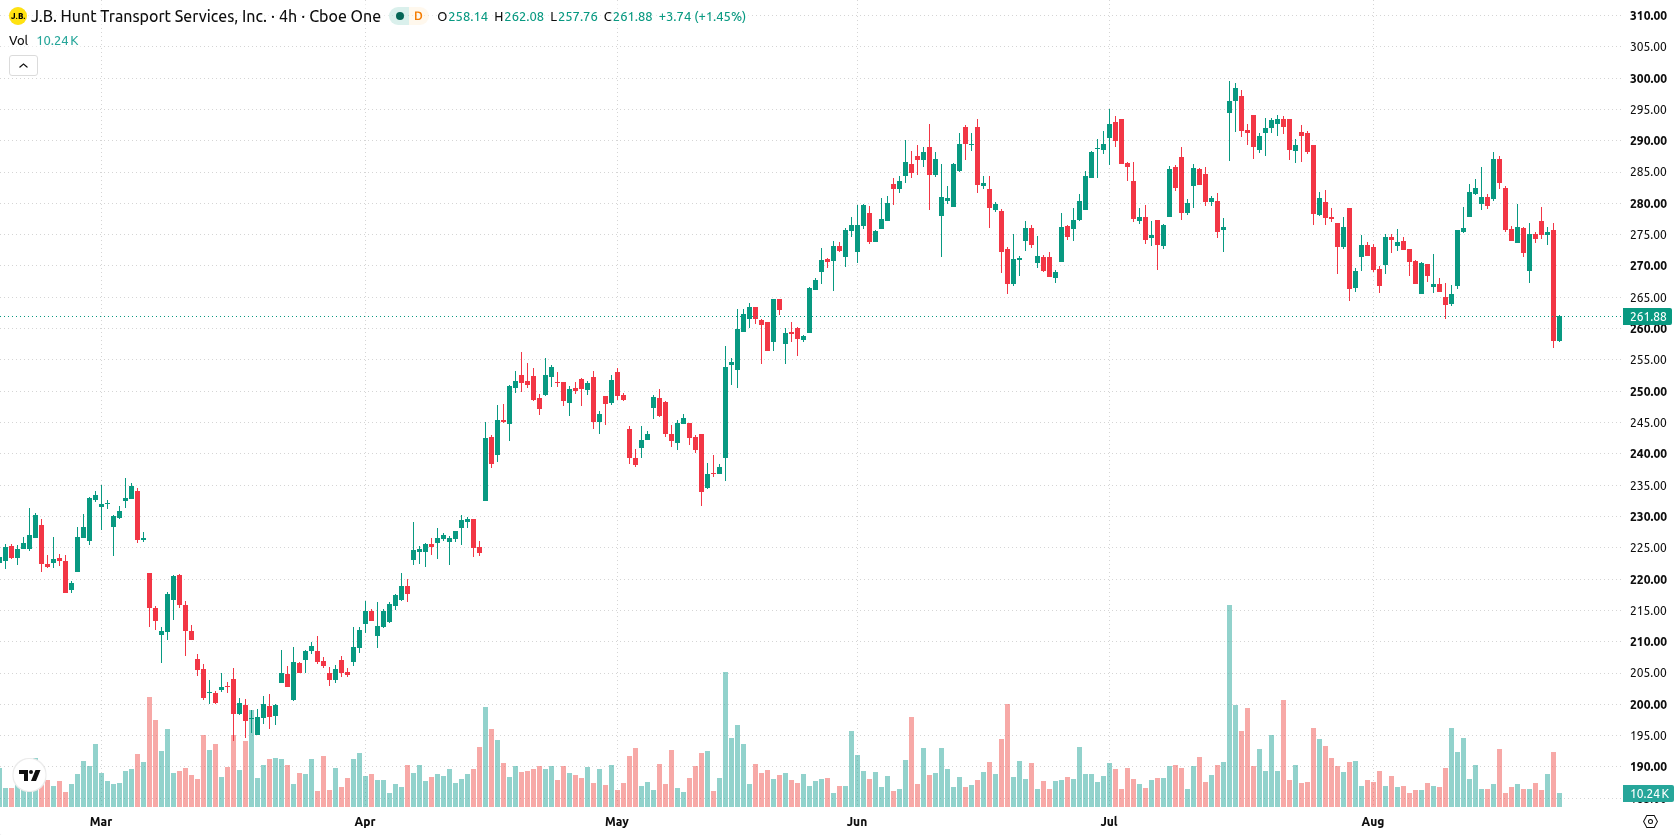
JB Hunt Transport Services (JBHT) slumped 5.06% as technical selling pressure dominated, with the stock breaking lower after remaining below both its 20-day and 50-day moving averages. The depth of the decline is reinforced by continued weakness across near- and mid-term trends, even as the longer-term uptrend remains intact above the 200-day moving average.
 221.83
232.26
Highlights
- Shares of JB Hunt fell 5.06% to $261.52, closing near the intraday low after early volatility of 7.36%.
- The stock trades below its near-term and medium-term moving averages but remains above its longer-term trend, indicating continued seller pressure short term.
- For the next five trading days, the price is expected to move within $244.4 to $268.94, with a 65% probability of an upward move and sideways consolidation likely.
Mixed momentum and resistance define action amid medium-term selling
JB Hunt is trading below both the 20-day and 50-day moving averages ($273.75 and $279.01), but well above the 200-day moving average ($232.63). This positioning signals near-term and medium-term pressure from sellers, although the longer-term uptrend remains intact as confirmed by the bullish alignment between the 50-day and 200-day averages. Immediate trading is framed by a near-term ceiling at $268.13 and a near-term floor at $256.79, while the Ichimoku Kijun at $279.63 reaffirms resistance above. Momentum signals are mixed. The Moving Average Convergence Divergence (MACD) shows a "Strong Sell" forecast and the Average Directional Index (ADX) remains neutral, indicating weak short-term momentum. The Relative Strength Index (RSI) sits at 49.27 with a Sell forecast, signaling the stock is drifting toward neutral after recent declines. Stochastic RSI and the Hull Moving Average (HMA) indicate a Buy, yet the Bull/Bear Power (BBP) reads 4.14, meaning buyers dominate intraday momentum and the overbought forecast suggests risks of a pullback. Commodity Channel Index (CCI) and Awesome Oscillator (AO) remain neutral. Today, the stock fell to $261.52, slipping 5.06% after opening with a small upside gap of $0.23 (0.08%), holding near the day's low with intraday volatility at 7.36%. This sharply lower close, with price near the session bottom, signals notable pressure after the open, partly diverging from mixed oscillator signals.
Earlier, analysts noted that JB Hunt exhibited sustained upward momentum supported by strong technical readings and the potential for a breakout. The current technical setback signals a shift to near-term consolidation around recent lows, with $244.40 as a critical support level to monitor for downside risk.






Latest JB Hunt Transport Services News




-
 Afghanistan
-
 Albania
-
 Algeria
-
 Angola
-
 Argentina
-
 Armenia
-
 Australia
-
 Austria
-
 Azerbaijan
-
 Bahamas
-
 Bahrain
-
 Bangladesh
-
 Belarus
-
 Belgium
-
 Bolivia
-
 Botswana
-
 Brazil
-
 Brunei
-
 Bulgaria
-
 Cambodia
-
 Cameroon
-
 Canada
-
 Chile
-
 China
-
 Colombia
-
 Congo
-
 Costa Rica
-
 Cote d'Ivoire
-
 Croatia
-
 Cuba
-
 Cyprus
-
 Czechia
-
 DR Congo
-
 Denmark
-
 Dominican Republic
-
 Ecuador
-
 Egypt
-
 El Salvador
-
 Estonia
-
 Eswatini
-
 Ethiopia
-
 Finland
-
 France
-
 Georgia
-
 Germany
-
 Ghana
-
 Greece
-
 Haiti
-
 Hong Kong
-
 Hungary
-
 India
-
 Indonesia
-
 Iran, Islamic republic
-
 Iraq
-
 Ireland
-
 Israel
-
 Italy
-
 Jamaica
-
 Japan
-
 Jordan
-
 Kazakhstan
-
 Kenya
-
 Korea
-
 Kuwait
-
 Kyrgyzstan
-
 Laos
-
 Latvia
-
 Lebanon
-
 Lesotho
-
 Libya
-
 Lithuania
-
 Luxembourg
-
 Madagascar
-
 Malaysia
-
 Malta
-
 Mauritius
-
 Mexico
-
 Moldova
-
 Mongolia
-
 Montenegro
-
 Morocco
-
 Mozambique
-
 Myanmar
-
 Namibia
-
 Nepal
-
 Netherlands
-
 New Zealand
-
 Nigeria
-
 North Macedonia
-
 Norway
-
 Oman
-
 Pakistan
-
 Palestine
-
 Panama
-
 Papua New Guinea
-
 Paraguay
-
 Peru
-
 Philippines
-
 Poland
-
 Portugal
-
 Puerto Rico
-
 Qatar
-
 Reunion
-
 Romania
-
 Rwanda
-
 Saudi Arabia
-
 Serbia
-
 Singapore
-
 Slovakia
-
 Slovenia
-
 Somalia
-
 South Africa
-
 Spain
-
 Sri Lanka
-
 Sweden
-
 Switzerland
-
 Syria
-
 Taiwan
-
 Tajikistan
-
 Tanzania
-
 Thailand
-
 Trinidad and Tobago
-
 Tunisia
-
 Turkey
-
 UAE
-
 Uganda
-
 Ukraine
-
 United Kingdom
-
United States
-
 Uruguay
-
 Uzbekistan
-
 Venezuela
-
 Vietnam
-
 Yemen
-
 Zambia
-
 Zimbabwe
- Forex
- Crypto












