


Technical selling pressure drove a sharp 3.84% decline in JB Hunt Transport Services (JBHT) after the stock gapped lower at the open, marking a clear downside move. The drop is reinforced by JBHT trading below its 20-day, 50-day, and 200-day moving averages, which highlights persistent weakness across all time frames.
 222.72
232.26
Highlights
- JB Hunt stock has fallen 3.84% and is trading below all key short-, medium-, and long-term moving averages, indicating persistent downside pressure.
- Momentum and oscillator signals are mixed, with negative trends in MACD and ADX but overbought readings in Stochastic RSI and intraday buyer presence, showing market uncertainty.
- JB Hunt stock is projected to fluctuate between $214.35 and $228.41 over the next five days, with a 54% probability of a downward move.
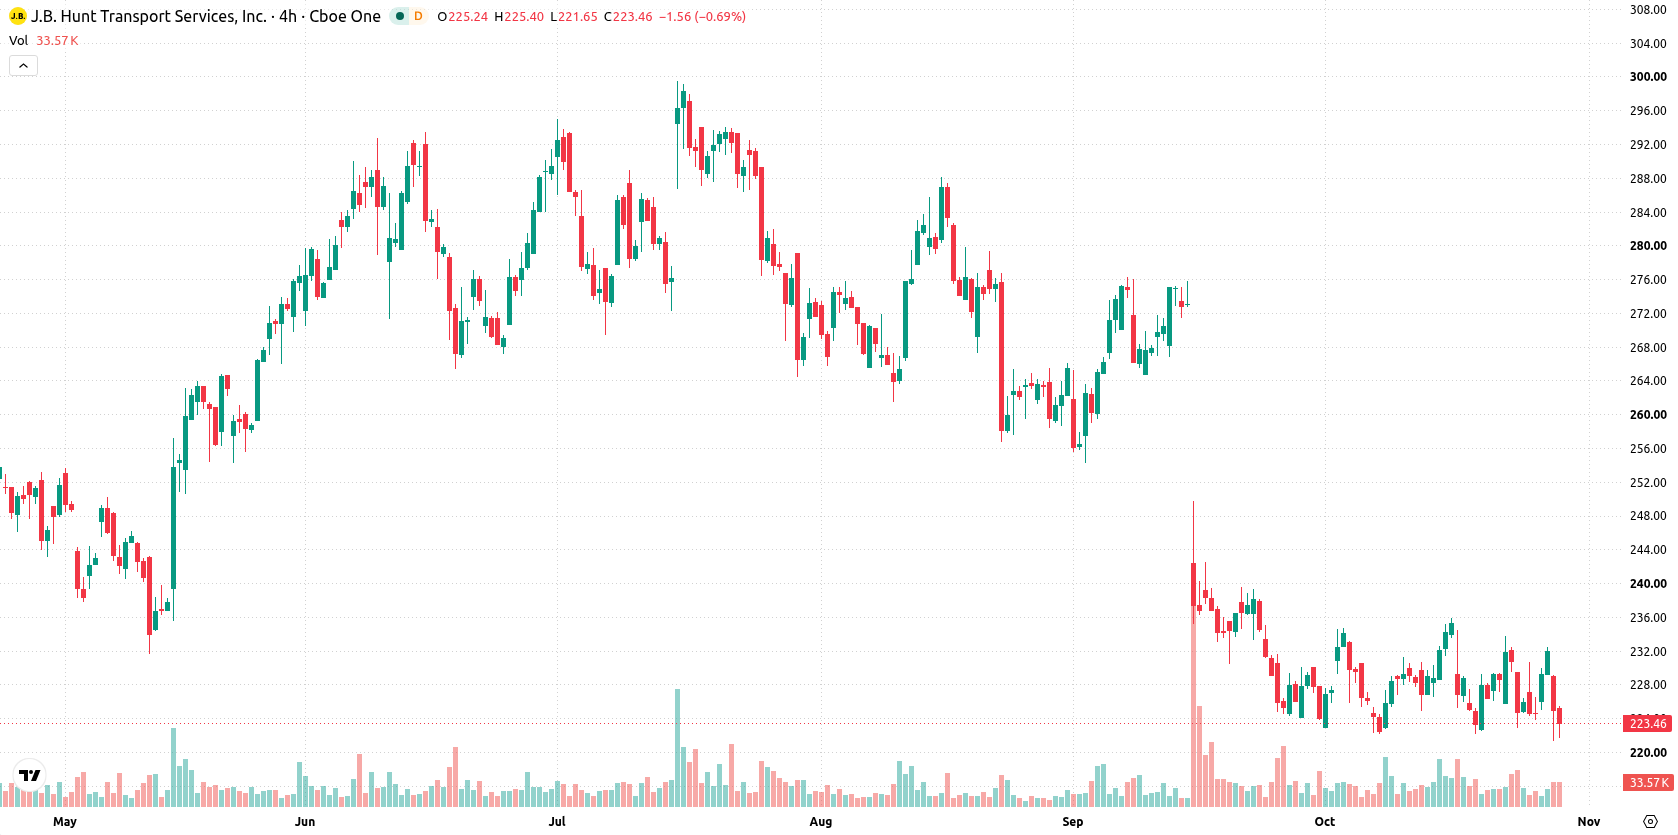
Mixed oscillator signals amid resistance cap and intraday volatility
JBHT is trading below the 20-day, 50-day, and 200-day moving averages at $228.28, $245, and $245.89, respectively, signaling downside pressure across all time frames. The stock is capped by near-term resistance at $228.28, with immediate support at $222.94. Momentum remains negative, as reflected by bearish MACD and ADX readings that suggest ongoing selling pressure. The RSI at 48.66 forecasts a 'Sell,' but the Stochastic RSI at 100 indicates an overbought condition. The CCI is positive at 51.84 and issues a 'Buy' signal, while the BBP at 3.58 points to intraday buying strength, though it is considered overbought. The Awesome Oscillator (AO) is neutral, not supporting the dominant trend. The stock is down sharply after a downside gap and is trading close to the session’s low, with volatility elevated at 3.63%. Oscillator signals are mixed, reflecting uncertainty about the prevailing trend.
Previously it was reported that JB Hunt shares moved lower following a quarterly earnings miss, with the decline highlighting investor sensitivity to profit performance even amid solid revenue results. The latest technical breakdown adds a new dimension by reinforcing the prevailing downside risk, making the $222.94 support level a critical threshold for traders to monitor in the near term.






Latest JB Hunt Transport Services News





-
 Afghanistan
-
 Albania
-
 Algeria
-
 Angola
-
 Argentina
-
 Armenia
-
 Australia
-
 Austria
-
 Azerbaijan
-
 Bahamas
-
 Bahrain
-
 Bangladesh
-
 Belarus
-
 Belgium
-
 Bolivia
-
 Botswana
-
 Brazil
-
 Brunei
-
 Bulgaria
-
 Cambodia
-
 Cameroon
-
 Canada
-
 Chile
-
 China
-
 Colombia
-
 Congo
-
 Costa Rica
-
 Cote d'Ivoire
-
 Croatia
-
 Cuba
-
 Cyprus
-
 Czechia
-
 DR Congo
-
 Denmark
-
 Dominican Republic
-
 Ecuador
-
 Egypt
-
 El Salvador
-
 Estonia
-
 Eswatini
-
 Ethiopia
-
 Finland
-
 France
-
 Georgia
-
 Germany
-
 Ghana
-
 Greece
-
 Haiti
-
 Hong Kong
-
 Hungary
-
 India
-
 Indonesia
-
 Iran, Islamic republic
-
 Iraq
-
 Ireland
-
 Israel
-
 Italy
-
 Jamaica
-
 Japan
-
 Jordan
-
 Kazakhstan
-
 Kenya
-
 Korea
-
 Kuwait
-
 Kyrgyzstan
-
 Laos
-
 Latvia
-
 Lebanon
-
 Lesotho
-
 Libya
-
 Lithuania
-
 Luxembourg
-
 Madagascar
-
 Malaysia
-
 Malta
-
 Mauritius
-
 Mexico
-
 Moldova
-
 Mongolia
-
 Montenegro
-
 Morocco
-
 Mozambique
-
 Myanmar
-
 Namibia
-
 Nepal
-
 Netherlands
-
 New Zealand
-
 Nigeria
-
 North Macedonia
-
 Norway
-
 Oman
-
 Pakistan
-
 Palestine
-
 Panama
-
 Papua New Guinea
-
 Paraguay
-
 Peru
-
 Philippines
-
 Poland
-
 Portugal
-
 Puerto Rico
-
 Qatar
-
 Reunion
-
 Romania
-
 Rwanda
-
 Saudi Arabia
-
 Serbia
-
 Singapore
-
 Slovakia
-
 Slovenia
-
 Somalia
-
 South Africa
-
 Spain
-
 Sri Lanka
-
 Sweden
-
 Switzerland
-
 Syria
-
 Taiwan
-
 Tajikistan
-
 Tanzania
-
 Thailand
-
 Trinidad and Tobago
-
 Tunisia
-
 Turkey
-
 UAE
-
 Uganda
-
 Ukraine
-
 United Kingdom
-
United States
-
 Uruguay
-
 Uzbekistan
-
 Venezuela
-
 Vietnam
-
 Yemen
-
 Zambia
-
 Zimbabwe
- Forex
- Crypto












