

WFC shares consolidation holds amid lack of trend and contained momentum: weekly analysis

Shares of Wells Fargo & Company (WFC) are trading near $84 with sellers still keeping pressure and the setup deep in oversold territory. Technical signals remain conflicted as momentum indicators point to both exhaustion and a lack of clear trend, setting up a cautious tone for the days ahead. With institutional flows showing little follow-through, the focus now shifts to whether buyers can reclaim lost ground or if the downside risk will persist into next week.
 86.36
89.45
Highlights
- Shares of Wells Fargo closed at $84.2, trading below key moving averages and showing weak near-term momentum.
- Technical indicators are mixed with oversold signals emerging and volatility at 4.67% over the past week.
- Shares are projected to trade between $82.45 and $85.94, with a base case of continued consolidation inside this range.
Institutional inflows increase this week amid value discount and dividend growth
Institutional investors such as Advisors Capital Management LLC and Equity Investment Corp recently reported sizable new or expanded positions in WFC, with Advisors Capital Management purchasing $52.07 million of shares and Equity Investment Corp acquiring approximately $124.36 million. Additional stakes were initiated or raised by Perigon Wealth Management LLC, Bell & Brown Wealth Advisors LLC, 1ST Source Bank, and Mill Capital Management LLC, further highlighting institutional interest in the company. Yahoo Finance noted the stock's strong total return over three years, trading at a discount to intrinsic value, and the fact that WFC has increased its dividend four times in the last five years, with the current yield at 2.29%.
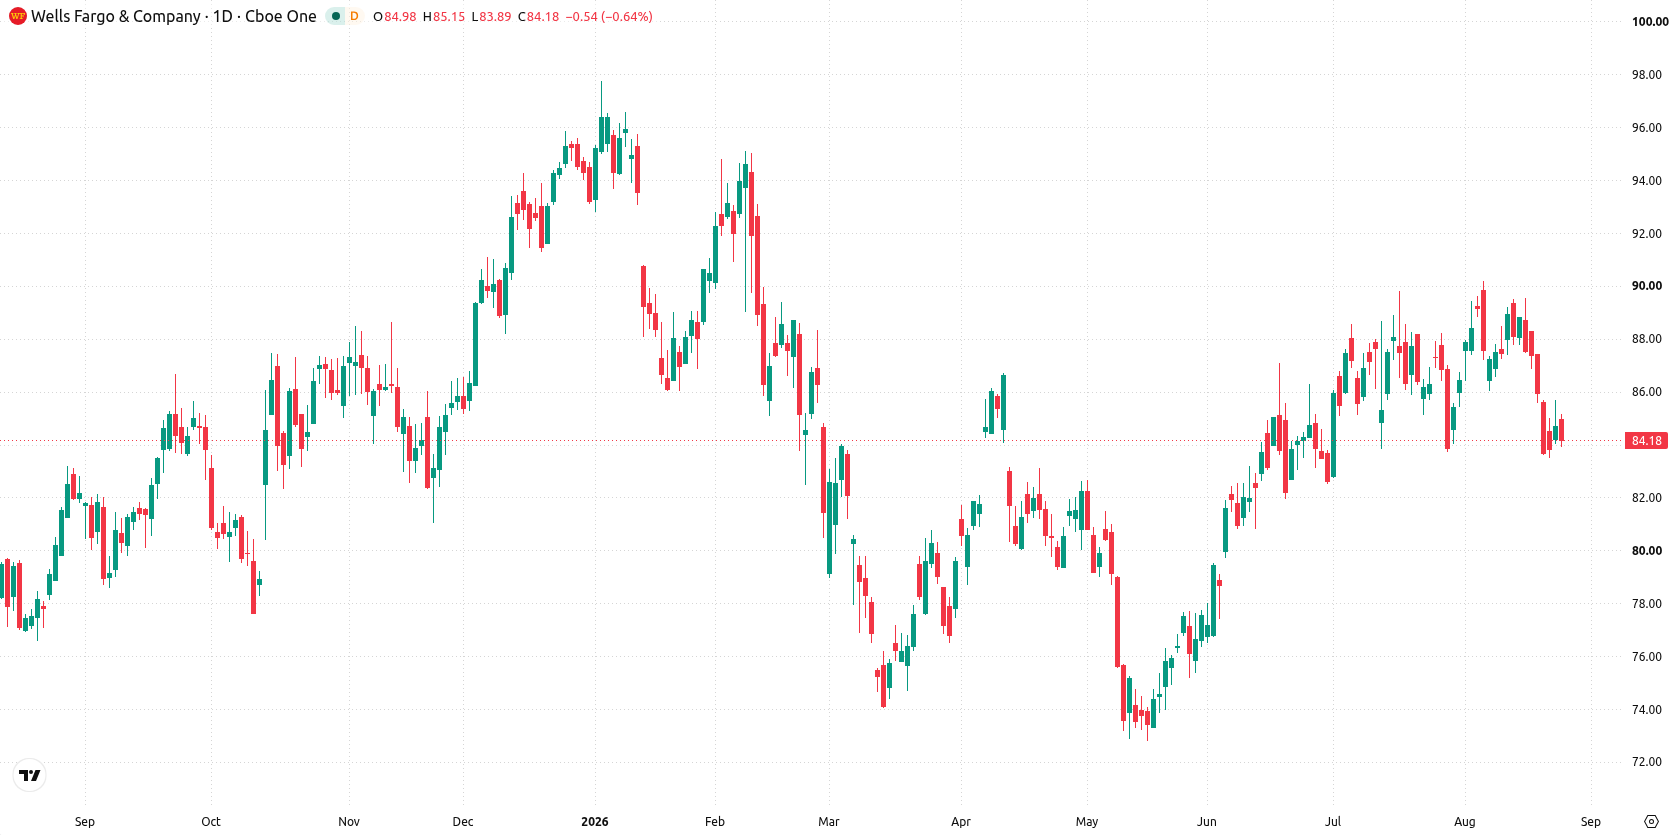
Oversold signals build over the week as price holds range lows
On the daily chart, the setup turns cautious with price action holding at the very bottom of the recent weekly range and volatility over the past 7 days at 4.67%. The RSI is neutral at 43.57, but the CCI is in the oversold zone and Stochastic RSI is approaching oversold, hinting at some loss of selling pressure. Trend signals remain mixed: the MACD is neutral, yet Bull/Bear Power highlights oversold conditions. The nearest support is seen at $83.51, while first resistance stands at $84.93, the level of the 200-day moving average, with the Ichimoku Kijun at $86.84 acting as an upper resistance.
Neutral bias next week as consolidation risk outweighs breakout momentum
For the coming trading week, Wells Fargo stock is expected to trade between $82.45 and $85.94, with a 45% probability of an increase and a 55% probability of a decline. Base case scenario is further consolidation inside this range, with momentum contained and no strong trend in play. If shares break above resistance at $84.93, the next test could be the Kijun at $86.84. A move below support at $83.51 would risk further downside towards the lower edge of the expected range.
In a recent review, Wells Fargo shares were highlighted for their constructive long-term technical outlook despite near-term consolidation. The current setup signals an inflection point, with traders watching for a sustained recovery above resistance at $84.93 or a breakdown below $83.51 to determine the next directional move.









-
 Afghanistan
-
 Albania
-
 Algeria
-
 Angola
-
 Argentina
-
 Armenia
-
 Australia
-
 Austria
-
 Azerbaijan
-
 Bahamas
-
 Bahrain
-
 Bangladesh
-
 Belarus
-
 Belgium
-
 Bolivia
-
 Botswana
-
 Brazil
-
 Brunei
-
 Bulgaria
-
 Cambodia
-
 Cameroon
-
 Canada
-
 Chile
-
 China
-
 Colombia
-
 Congo
-
 Costa Rica
-
 Cote d'Ivoire
-
 Croatia
-
 Cuba
-
 Cyprus
-
 Czechia
-
 DR Congo
-
 Denmark
-
 Dominican Republic
-
 Ecuador
-
 Egypt
-
 El Salvador
-
 Estonia
-
 Eswatini
-
 Ethiopia
-
 Finland
-
 France
-
 Georgia
-
 Germany
-
 Ghana
-
 Greece
-
 Haiti
-
 Hong Kong
-
 Hungary
-
 India
-
 Indonesia
-
 Iran, Islamic republic
-
 Iraq
-
 Ireland
-
 Israel
-
 Italy
-
 Jamaica
-
 Japan
-
 Jordan
-
 Kazakhstan
-
 Kenya
-
 Korea
-
 Kuwait
-
 Kyrgyzstan
-
 Laos
-
 Latvia
-
 Lebanon
-
 Lesotho
-
 Libya
-
 Lithuania
-
 Luxembourg
-
 Madagascar
-
 Malaysia
-
 Malta
-
 Mauritius
-
 Mexico
-
 Moldova
-
 Mongolia
-
 Montenegro
-
 Morocco
-
 Mozambique
-
 Myanmar
-
 Namibia
-
 Nepal
-
 Netherlands
-
 New Zealand
-
 Nigeria
-
 North Macedonia
-
 Norway
-
 Oman
-
 Pakistan
-
 Palestine
-
 Panama
-
 Papua New Guinea
-
 Paraguay
-
 Peru
-
 Philippines
-
 Poland
-
 Portugal
-
 Puerto Rico
-
 Qatar
-
 Reunion
-
 Romania
-
 Rwanda
-
 Saudi Arabia
-
 Serbia
-
 Singapore
-
 Slovakia
-
 Slovenia
-
 Somalia
-
 South Africa
-
 Spain
-
 Sri Lanka
-
 Sweden
-
 Switzerland
-
 Syria
-
 Taiwan
-
 Tajikistan
-
 Tanzania
-
 Thailand
-
 Trinidad and Tobago
-
 Tunisia
-
 Turkey
-
 UAE
-
 Uganda
-
 Ukraine
-
 United Kingdom
-
United States
-
 Uruguay
-
 Uzbekistan
-
 Venezuela
-
 Vietnam
-
 Yemen
-
 Zambia
-
 Zimbabwe
- Forex
- Crypto












