


Intuit Inc. (INTU) fell 2.73% as recent corporate actions and anticipated earnings did little to shift selling pressure ahead of the fiscal fourth quarter 2026 report. The move comes with the stock holding above its 20-day and 50-day moving averages, but technicals show persistent long-term headwinds with resistance still overhead.
 332.03
351.38
Highlights
- Intuit enacted a 17% workforce reduction while delivering double-digit revenue growth ahead of its fiscal fourth quarter 2026 earnings report on August 25.
- Revenue gains came from QuickBooks, Credit Karma, and AI-enabled offerings, with continued investment in consumer and business platform integration.
- Shares of Intuit trade at $359.83 amid bullish short-term momentum, with an expected five-day range of $348 to $371.66 as technical indicators flag overbought conditions.
Earnings report and cost cuts overshadowed by sustained selling pressure
Intuit is scheduled to report its fiscal fourth quarter 2026 earnings after market close on August 25. The company implemented a 17% workforce reduction aimed at improving operating margins in recent quarters, which showed double-digit revenue growth. Revenue performance was driven by QuickBooks, Credit Karma, and AI-enabled offerings, as new investments were made in platform integration for consumers, small businesses, and accountants, though price action has remained under broader selling pressure.
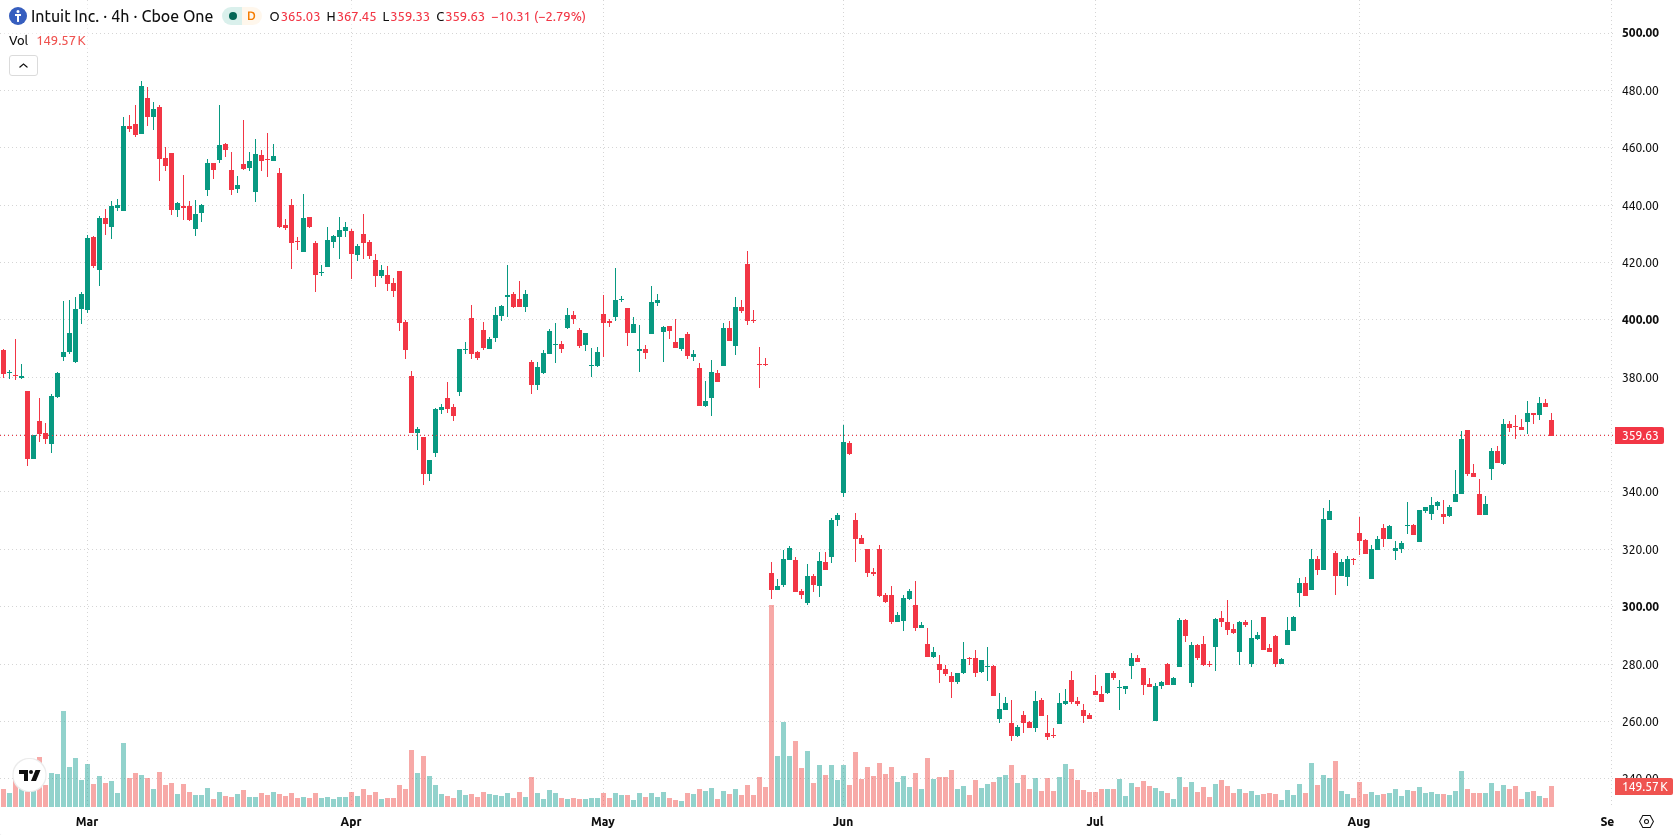
Long-term resistance persists amid mixed technical momentum
The stock is trading above its 20-day and 50-day moving averages at $337.58 and $301.16, indicating positive short- and medium-term momentum. However, it remains below the 200-day moving average at $440.99, reflecting persistent long-term pressure. Resistance is present at the near-term ceiling of $365.1, with support at the floor of $349.32. Both MACD and ADX show bullish signals, backed by a positive Awesome Oscillator reading. The RSI is high at 68.89, with CCI and Bull/Bear Power also flagging overbought conditions. Stochastic RSI is at a neutral 77.48. The session saw a gap down at the open, with the stock remaining near session lows and intraday volatility measured at 2.16%. Sellers maintained pressure intraday despite underlying bullish momentum.
Earlier, analysts noted that Intuit was facing a key resistance level and overbought technical signals, leaving the outlook cautious despite recent corporate actions. The current article adds that near-term technicals remain stretched but identifies $365.1 as the critical mark to monitor for a possible upside break or renewed downside risk in the coming sessions.











-
 Afghanistan
-
 Albania
-
 Algeria
-
 Angola
-
 Argentina
-
 Armenia
-
 Australia
-
 Austria
-
 Azerbaijan
-
 Bahamas
-
 Bahrain
-
 Bangladesh
-
 Belarus
-
 Belgium
-
 Bolivia
-
 Botswana
-
 Brazil
-
 Brunei
-
 Bulgaria
-
 Cambodia
-
 Cameroon
-
 Canada
-
 Chile
-
 China
-
 Colombia
-
 Congo
-
 Costa Rica
-
 Cote d'Ivoire
-
 Croatia
-
 Cuba
-
 Cyprus
-
 Czechia
-
 DR Congo
-
 Denmark
-
 Dominican Republic
-
 Ecuador
-
 Egypt
-
 El Salvador
-
 Estonia
-
 Eswatini
-
 Ethiopia
-
 Finland
-
 France
-
 Georgia
-
 Germany
-
 Ghana
-
 Greece
-
 Haiti
-
 Hong Kong
-
 Hungary
-
 India
-
 Indonesia
-
 Iran, Islamic republic
-
 Iraq
-
 Ireland
-
 Israel
-
 Italy
-
 Jamaica
-
 Japan
-
 Jordan
-
 Kazakhstan
-
 Kenya
-
 Korea
-
 Kuwait
-
 Kyrgyzstan
-
 Laos
-
 Latvia
-
 Lebanon
-
 Lesotho
-
 Libya
-
 Lithuania
-
 Luxembourg
-
 Madagascar
-
 Malaysia
-
 Malta
-
 Mauritius
-
 Mexico
-
 Moldova
-
 Mongolia
-
 Montenegro
-
 Morocco
-
 Mozambique
-
 Myanmar
-
 Namibia
-
 Nepal
-
 Netherlands
-
 New Zealand
-
 Nigeria
-
 North Macedonia
-
 Norway
-
 Oman
-
 Pakistan
-
 Palestine
-
 Panama
-
 Papua New Guinea
-
 Paraguay
-
 Peru
-
 Philippines
-
 Poland
-
 Portugal
-
 Puerto Rico
-
 Qatar
-
 Reunion
-
 Romania
-
 Rwanda
-
 Saudi Arabia
-
 Serbia
-
 Singapore
-
 Slovakia
-
 Slovenia
-
 Somalia
-
 South Africa
-
 Spain
-
 Sri Lanka
-
 Sweden
-
 Switzerland
-
 Syria
-
 Taiwan
-
 Tajikistan
-
 Tanzania
-
 Thailand
-
 Trinidad and Tobago
-
 Tunisia
-
 Turkey
-
 UAE
-
 Uganda
-
 Ukraine
-
 United Kingdom
-
United States
-
 Uruguay
-
 Uzbekistan
-
 Venezuela
-
 Vietnam
-
 Yemen
-
 Zambia
-
 Zimbabwe
- Forex
- Crypto












