

Intuit shares drop more than 4% after 2027 guidance and 17% workforce reduction

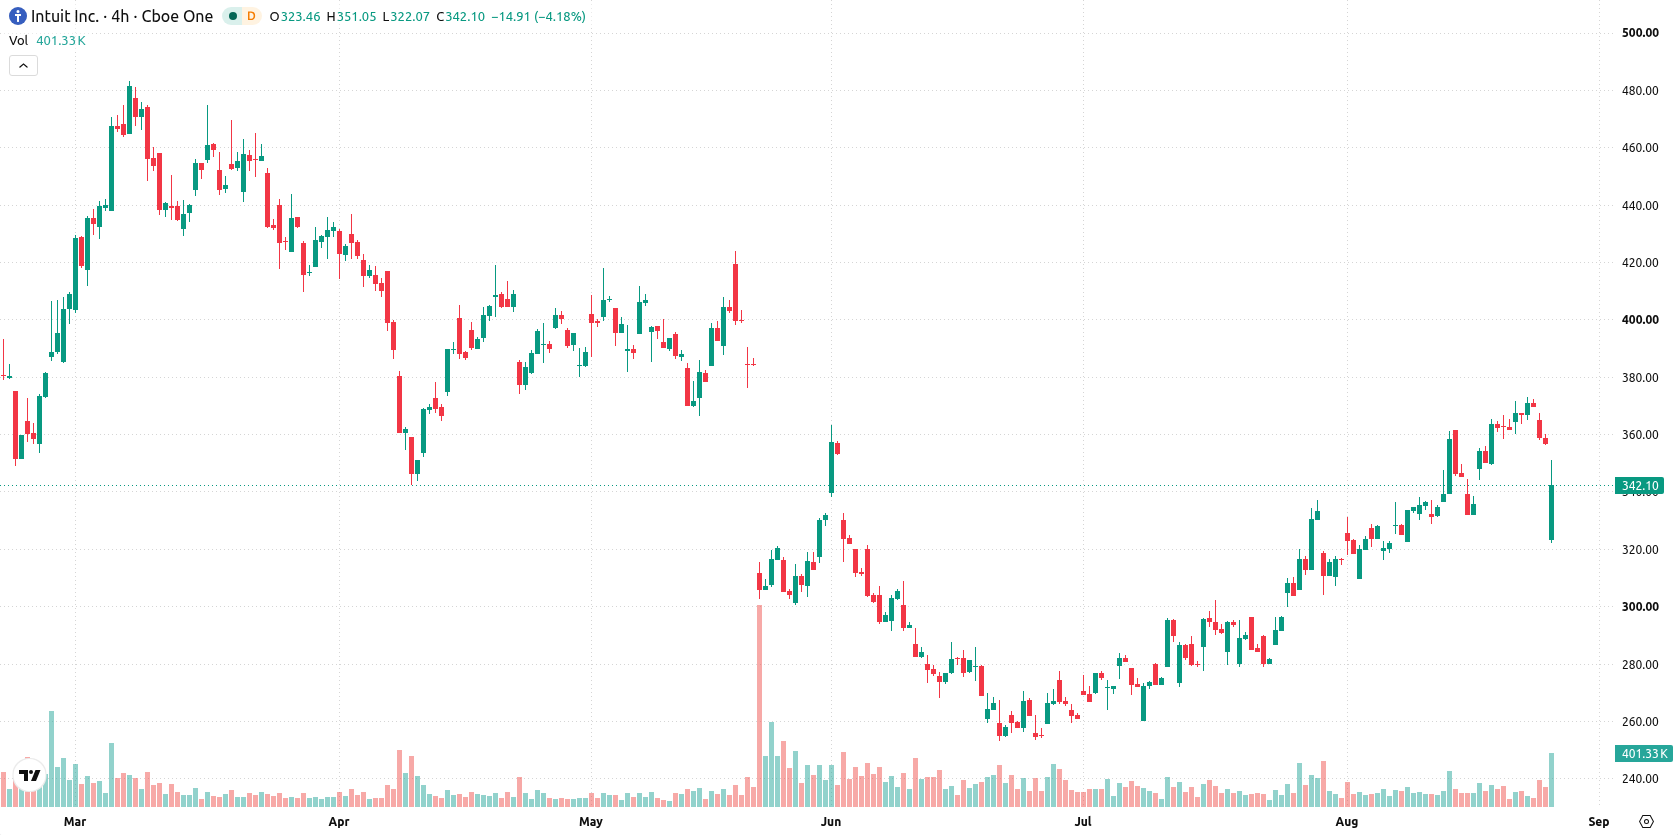
Intuit Inc. (INTU) slumped 4.3% after the company released fiscal 2026 results that beat quarterly earnings and revenue estimates, with a drop fueled by lower-than-expected guidance for fiscal 2027 and newly announced restructuring. The move is supported by INTU trading below its 200-day moving average and strong early selling pressure, even as short- and medium-term technicals show underlying strength.
 341.50
351.39
Highlights
- Intuit revenue reached $4.35 billion and earnings per share were $4.03, both above analyst forecasts.
- Fiscal 2027 guidance for revenue and adjusted EPS came in below expectations, alongside a 17% workforce reduction and new $8 billion share buyback.
- Shares of Intuit trade near $342.1 after early gains reversed, with technicals showing overbought conditions and a 57% probability of moving below $333.62 in the next week.
Underperformance as guidance, layoffs, and buybacks reshape sentiment
Intuit reported fourth quarter and full fiscal year 2026 results, with earnings per share of $4.03 and revenue of $4.35 billion, both exceeding analyst estimates. The company issued fiscal 2027 revenue and adjusted EPS guidance below Wall Street expectations, introduced a 17% workforce reduction, and shifted investment priorities toward new customer acquisition in response to slower growth in its core segments. The board increased the quarterly dividend by 15% to $1.38 per share and approved an $8 billion share repurchase program, though price action has remained under broader selling pressure.
Short-term gains pressured by long-term weakness and overbought signals
INTU is trading above its 20-day and 50-day moving averages ($337.59 and $301.17), but remains below the 200-day moving average at $440.99. This setup indicates underlying short- and medium-term strength contrasted against a still-bearish long-term trend. The near-term resistance level is at $356.02, with initial support at $337.59. Momentum indicators, including the MACD and ADX, confirm sustained bullish energy intraday, and the RSI is elevated at 68.96 with a 'Buy' bias, even as CCI and Bull/Bear Power both flag overbought conditions. The Awesome Oscillator also points to persistent buying interest, but the stock has moved sharply lower after an early upside gap, now trading near today's low as sellers dominate intraday action.
Earlier, analysts noted that Intuit faced persistent long-term resistance and mixed technical signals, resulting in a cautious outlook. The current article adds a new dimension with confirmation of underlying short- and medium-term strength but persistent long-term weakness, making the $365.6 and $333.62 levels key pivots for monitoring potential breakout or breakdown scenarios in the days ahead.











-
 Afghanistan
-
 Albania
-
 Algeria
-
 Angola
-
 Argentina
-
 Armenia
-
 Australia
-
 Austria
-
 Azerbaijan
-
 Bahamas
-
 Bahrain
-
 Bangladesh
-
 Belarus
-
 Belgium
-
 Bolivia
-
 Botswana
-
 Brazil
-
 Brunei
-
 Bulgaria
-
 Cambodia
-
 Cameroon
-
 Canada
-
 Chile
-
 China
-
 Colombia
-
 Congo
-
 Costa Rica
-
 Cote d'Ivoire
-
 Croatia
-
 Cuba
-
 Cyprus
-
 Czechia
-
 DR Congo
-
 Denmark
-
 Dominican Republic
-
 Ecuador
-
 Egypt
-
 El Salvador
-
 Estonia
-
 Eswatini
-
 Ethiopia
-
 Finland
-
 France
-
 Georgia
-
 Germany
-
 Ghana
-
 Greece
-
 Haiti
-
 Hong Kong
-
 Hungary
-
 India
-
 Indonesia
-
 Iran, Islamic republic
-
 Iraq
-
 Ireland
-
 Israel
-
 Italy
-
 Jamaica
-
 Japan
-
 Jordan
-
 Kazakhstan
-
 Kenya
-
 Korea
-
 Kuwait
-
 Kyrgyzstan
-
 Laos
-
 Latvia
-
 Lebanon
-
 Lesotho
-
 Libya
-
 Lithuania
-
 Luxembourg
-
 Madagascar
-
 Malaysia
-
 Malta
-
 Mauritius
-
 Mexico
-
 Moldova
-
 Mongolia
-
 Montenegro
-
 Morocco
-
 Mozambique
-
 Myanmar
-
 Namibia
-
 Nepal
-
 Netherlands
-
 New Zealand
-
 Nigeria
-
 North Macedonia
-
 Norway
-
 Oman
-
 Pakistan
-
 Palestine
-
 Panama
-
 Papua New Guinea
-
 Paraguay
-
 Peru
-
 Philippines
-
 Poland
-
 Portugal
-
 Puerto Rico
-
 Qatar
-
 Reunion
-
 Romania
-
 Rwanda
-
 Saudi Arabia
-
 Serbia
-
 Singapore
-
 Slovakia
-
 Slovenia
-
 Somalia
-
 South Africa
-
 Spain
-
 Sri Lanka
-
 Sweden
-
 Switzerland
-
 Syria
-
 Taiwan
-
 Tajikistan
-
 Tanzania
-
 Thailand
-
 Trinidad and Tobago
-
 Tunisia
-
 Turkey
-
 UAE
-
 Uganda
-
 Ukraine
-
 United Kingdom
-
United States
-
 Uruguay
-
 Uzbekistan
-
 Venezuela
-
 Vietnam
-
 Yemen
-
 Zambia
-
 Zimbabwe
- Forex
- Crypto












